USDCNH - Chinese Renminbi 24 January 2023
Long term view: USDCNH is in a 40 week cycle trough zone and downside risk is limited. Expecting a meaningful advance soon.
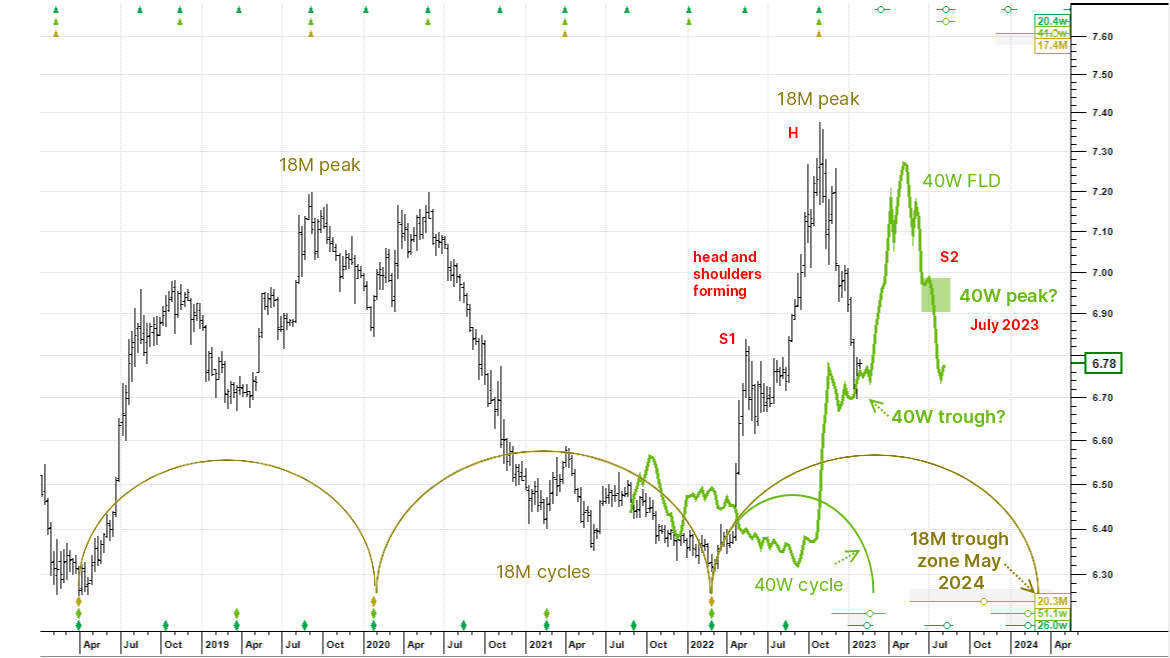
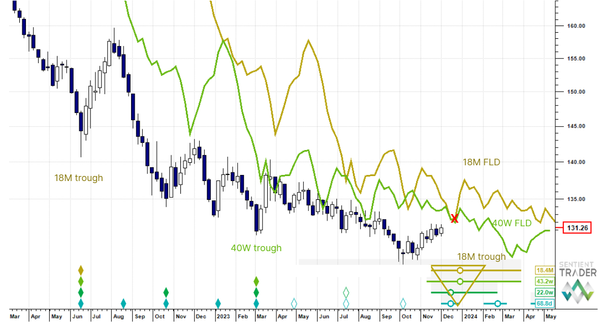
The long term chart's phasing analysis (placement of peaks and troughs in the dataset) is clean and has good rhythm, we trust it. The big semicircles representing 18 month cycles have been drawn in and note at the bottom right of the chart the average wavelength is 20.3 months. The February 2022 low is confirmed as the last 18 month cycle trough and the next is due in early 2024.
Cycles are harmonically related and typically have a 2 to 1 ratio in Hurst cycle analysis and the next shorter neighbour is the 40 week cycle (two 40 week cycles in one 18 month cycle). The average wavelength of this cycle in the series is 51.1 weeks and the last 40 week trough was coincident with the last 18 month trough in February 2022. The next trough therefore is due mid next month. It could be a bit earlier, it could be a bit later, but roughly this is where it is expected. So the long term view gives us some great insight: downside risk is limited in terms of time and price because a high magnitude trough is due. Also note that price has landed at a 40 week FLD, which is ostensible support in the 40 week trough zone.
The big top at the end of last October was an 18 month cycle peak and we believe that it represents the head of a long term head and shoulders pattern. The advance out of the anticipated 40 week trough should lead price into the second shoulder (S2) circa 6.90 to 7.00 in July. After that price should fall dramatically.
Near term view: although in the zone, some more downside expected before the actual 40 week trough.
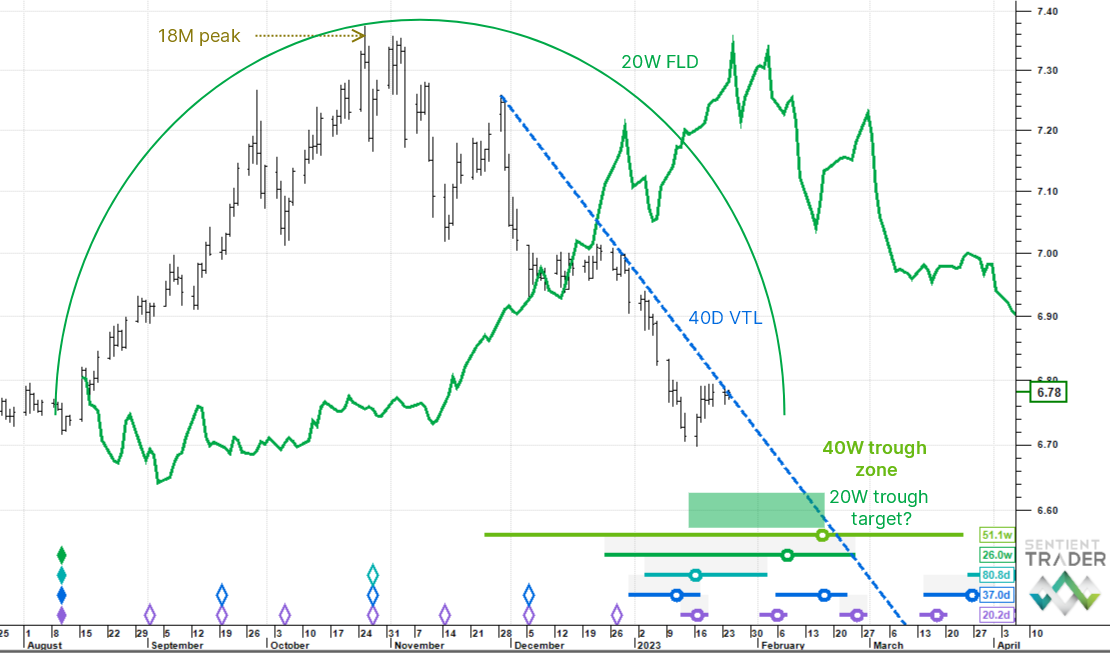
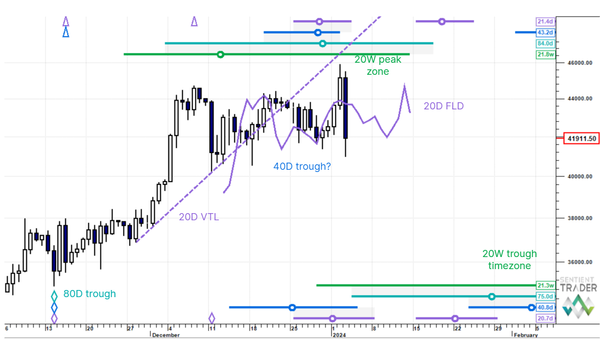
Tracking the last 20 week cycle in the 40 week cycle whose trough we are stalking, the average wavelength is 26 weeks here and we are still only 23.9 weeks along, suggesting that price is not quite there. A 20 week FLD has been plotted and the price cross last December gives a downside target of roughly 6.60.
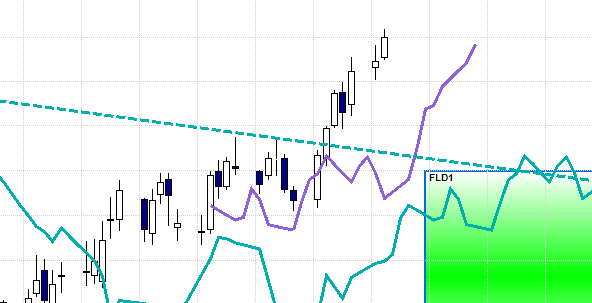
Price has just drifted into a 40 day VTL (the blue valid trend-line associated with the 40 day cycle). A sharp cross up through this confirms that the 80 day cycle trough occurred on 16 January, and this would mean that the 20 week and 40 week troughs must also be in (Hurst's principle of trough synchronicity). However, because our stance is that the big trough is still due, we think the 40 day VTL serves as a resistance barrier here.