
Macro Outlook - 17 April 2023 (sample most recent)
You will come across specific terms in these notes (FLD, VTL, and so on). Rather than explain them each time, you will find definitions here: guidance notes for Hurst cycles terminology
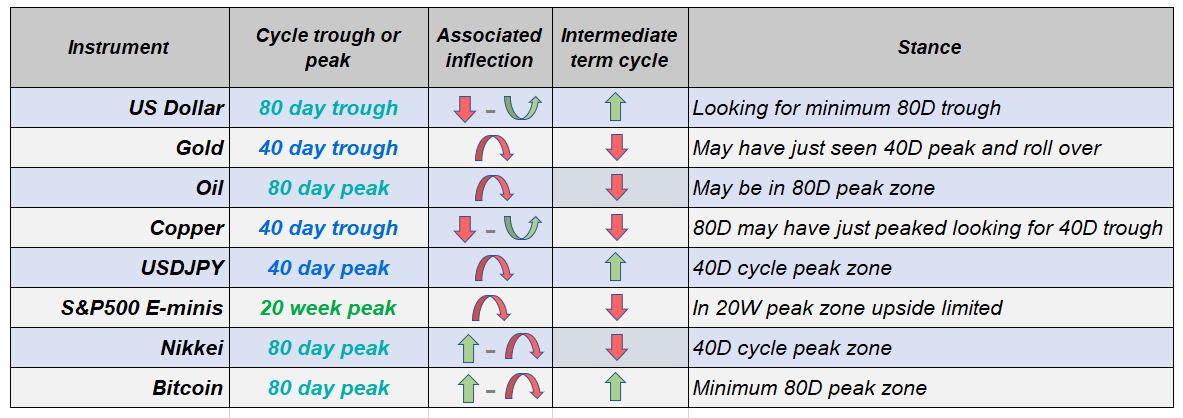
Dollar Index - still struggling/down, but an upside resolution by end April is the higher probability outcome.
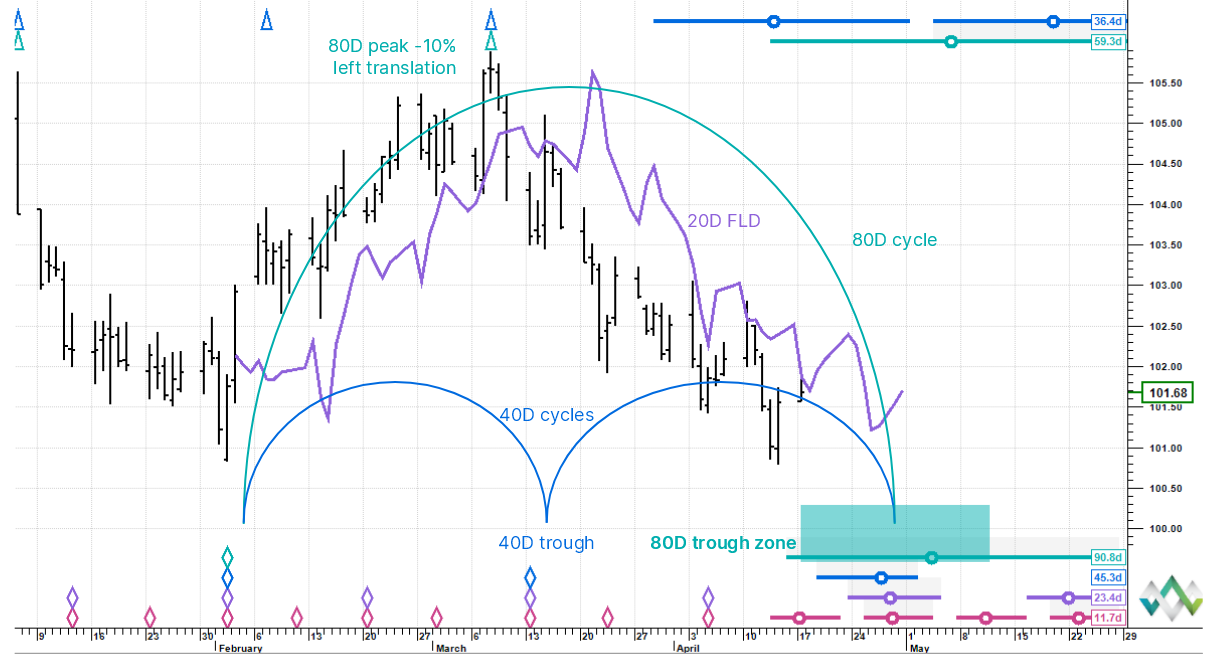
Current stance - looking for the 80 day cycle trough.
There is a cluster of future trough circles in the last week of the month, which is at least up to 80 day cycle magnitude and could even be an 18 month cycle trough. The latter is a big call, so we will stalk a new 80 day cycle for now. In any case this should lead to a tradeable upside resolution and as price action unfolds we should be able to confirm the cycle's size.
20 day FLD.
A 20 day FLD has been plotted on top of price since the last 80 day cycle trough in early February and the current FLD/price interaction is the eighth in the cycle, which would make it the last one of the sequence. Overall, downside risk looks to be limited to above 100 and a brewing upside reversal the higher probability outcome.
Gold - top zone chop, but downside reversal at minimum of 40 day cycle magnitude looks to have just occurred.
Current stance - 40 day cycle may have peaked.
A 20 day VTL was just crossed down by price which potentially confirms that the 13 April high was the 40 day cycle peak. Still looking for a decline into the last week of the month or first week of May into at least a 40 day cycle trough. A sine wave based on 40 day cycle troughs has been plotted to describe the price arc and peaks and troughs. Because the US Dollar needs to stabilise into its ostensible next trough, some chop is expected in Gold near term.
40 day FLD and general trend
An FLD based on the 40 day cycle could be crossed down around 1,994 which projects to 1,925. The decline could be somewhat shallower (i.e. FLD downside projection undershot) because the underlying trend remains up (a 20 week cycle bottomed at the end of February and shorter cycle peaks have been pushed forward in time).
Oil (WTI) - recent cycle needs to return to natural rhythm, but upside risk looks limited at these levels.
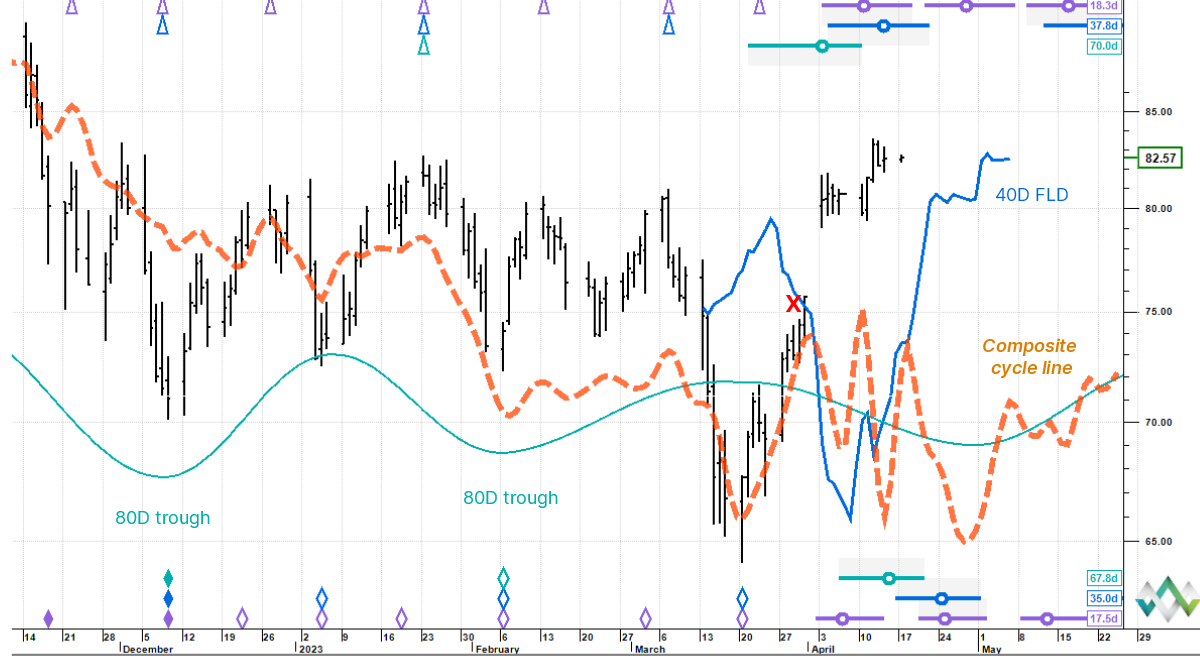
Current stance - looks to be nearing rally top zone.
The cycles analysis had that Oil should have broken down at the end of March just below 75 and then drop sharply into the end of April. However, a fundamentals shock threw the cycles off and we saw a breakout rally. The synthetic composite cycle line shows that the cycles trajectory should have been significantly more muted. Typically the impact of fundamentals shock is short lived.
FLD projections
The chart shows that a 40 day cycle FLD was crossed up at the OPEC announcement at the end of March and the projection is just above 85. What the chart does not show, for the sake of clarity, is that the 80 day FLD as well as the 20 week FLD were also crossed up at exactly the same time and the same level. These longer cycle FLDs are now heavily in conflict, which makes us believe that the 40 day FLD target will be undershot. After the anticipated top out we will re- assess the phasing analysis and downside potential.
Copper- looking for pullback but choppy action makes definitive call harder.
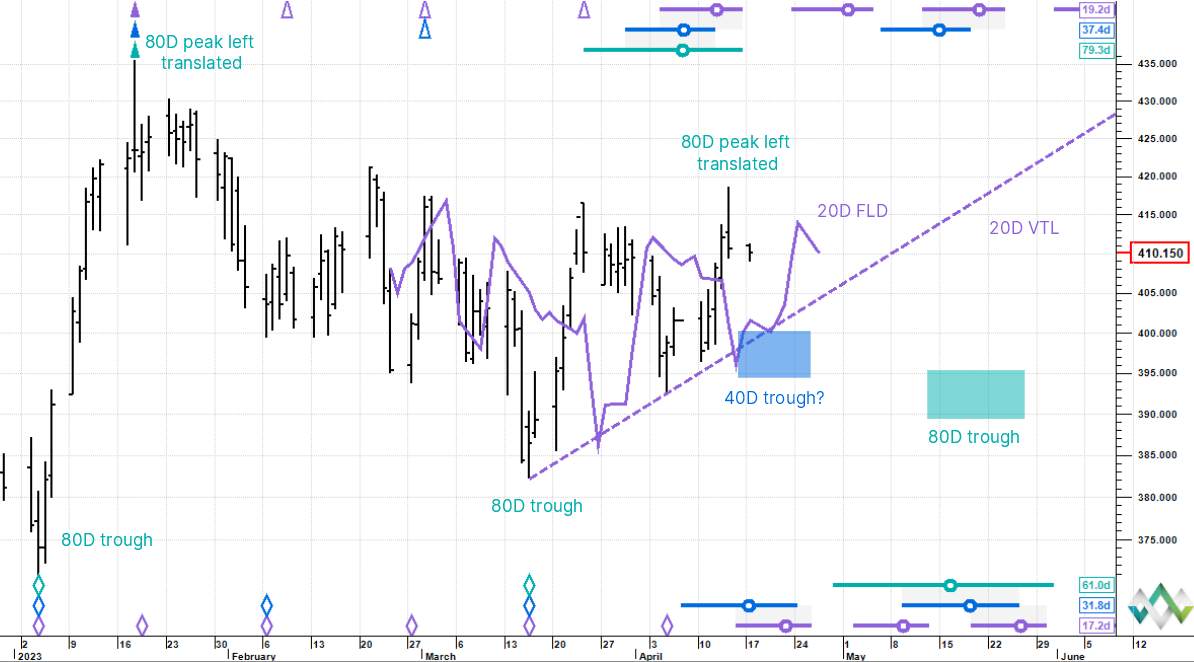
Current stance - downside risk looks to be higher probability.
There looks to be a general drift lower towards at least an 80 day cycle trough due from mid-May. One projection has this at around 390. The overall tenor of the chart is bearish which is highlighted by generally early peaks from the start of the year.
40 day cycle trough
The preferred view near term is that Copper just passed through an early 80 day cycle peak and is headed down towards the 20 day FLD and VTL into a 40 day cycle trough due next week, however there could very well be a lack of clarity in price action over the coming week. What we are not looking for is price to exceed last week's high.
USD correlation
There is a high inverse correlation with the US Dollar at -89% (up from only -40% YTD) over the last seven days which could lead to choppy price action in Copper as the US Dollar moves down into the next 80 day cycle trough into month end (our preferred view).
USDJPY - March rally running out of steam.
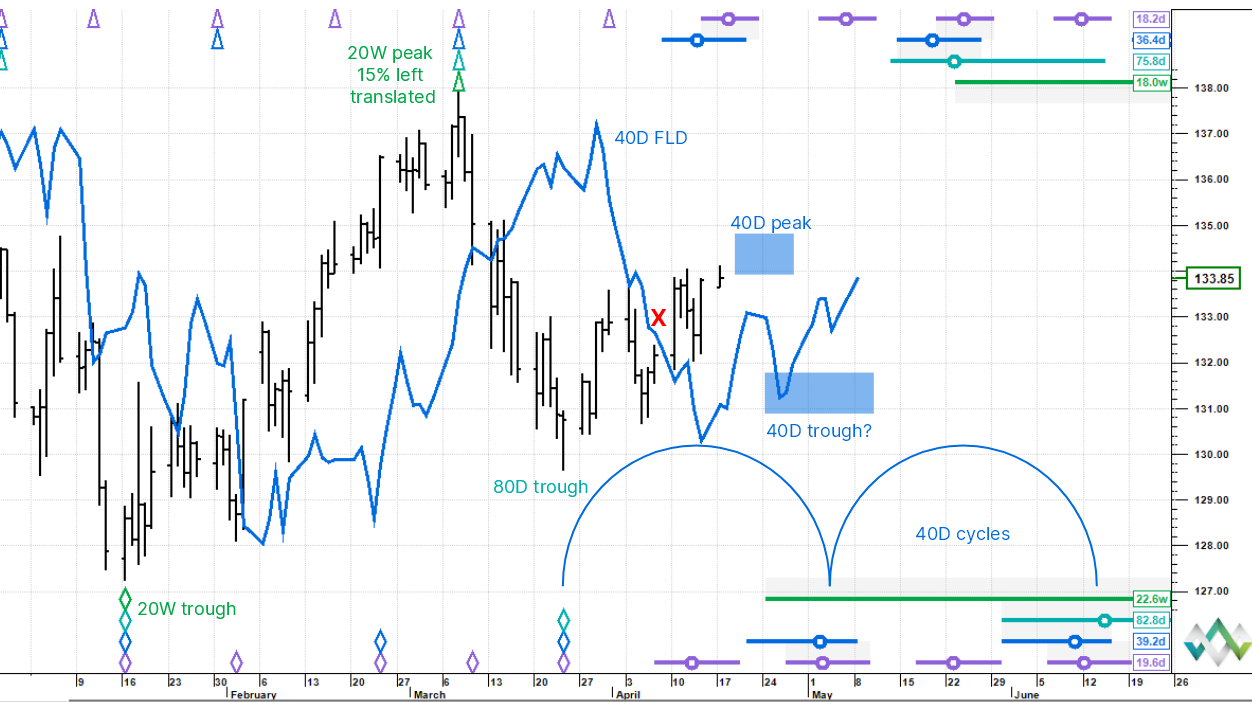
Current stance - nearing 40 day cycle peak zone.
An 80 day cycle kicked off on 24 March, but looks to be running into headwinds now. The 40 day FLD was crossed up by price last Monday and projects to just under 135, i.e. the peak of the cycle. The 40 day cycle trough timezone is pretty clear into early May and we are expecting price to stall shortly and then pullback. There are reasons to expect the rally out of the next 40 day cycle trough to be muted and for a more bearish tenor into the 80 day cycle trough expected in June, but we will address these once we see the full rotation of the current 40 day cycle.
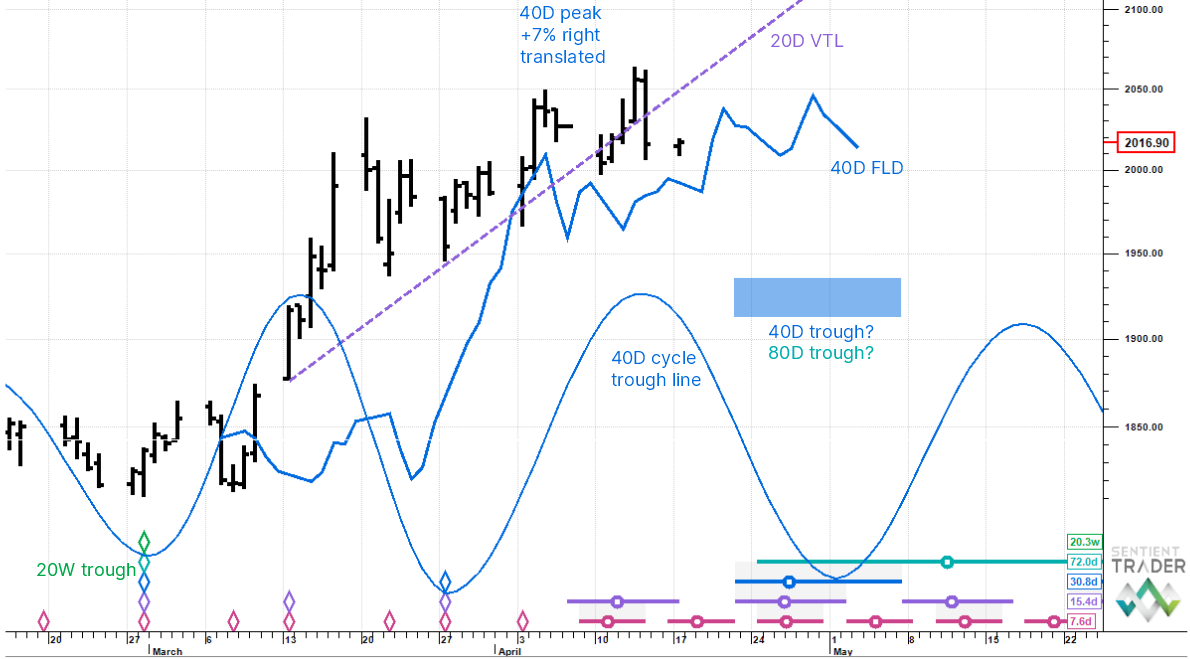
S&P500 E-Minis - upside risk limited, in 20 week cycle peak zone.
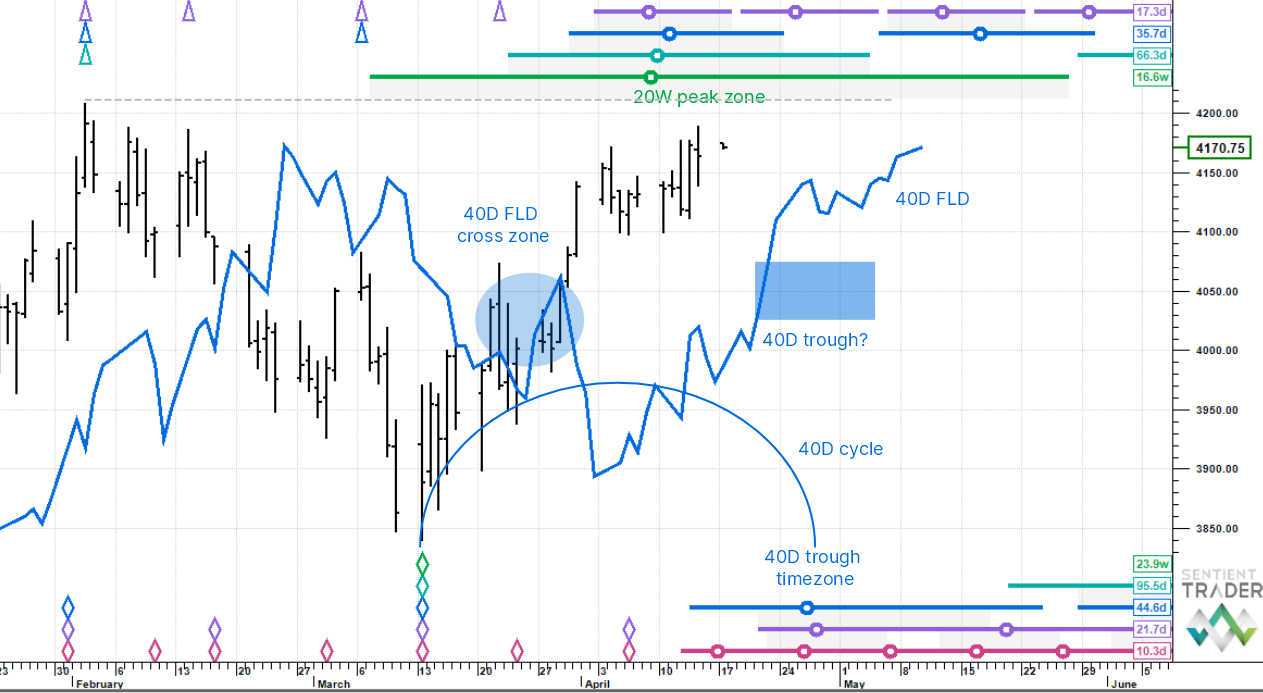
Current stance - higher magnitude peak zone.
Price is still closing in on the obvious liquidity magnet of 4,200 roughly the February top zone. There is a coherent peak circles cluster directly above us now up to at least 20 week cycle magnitude. Price crisscrossed up through the 40 day FLD incoherently towards the end of March but gave a median cross level of 3,991 which projects to 4,154 as a rough guide to target (price is currently just above this). So all told the preferred view is that upside risk is limited here.
40 day cycle rotating.
The next 40 day cycle trough is due from the end of the month and our preferred view is a pullback starts shortly and falls into this area. There should be a muted rally then, but the current view is that we see lower prices thereafter. We will update once the current 40 day cycle has rotated.
Nikkei - 80 day cycle peak zone expected, upside risk limited.
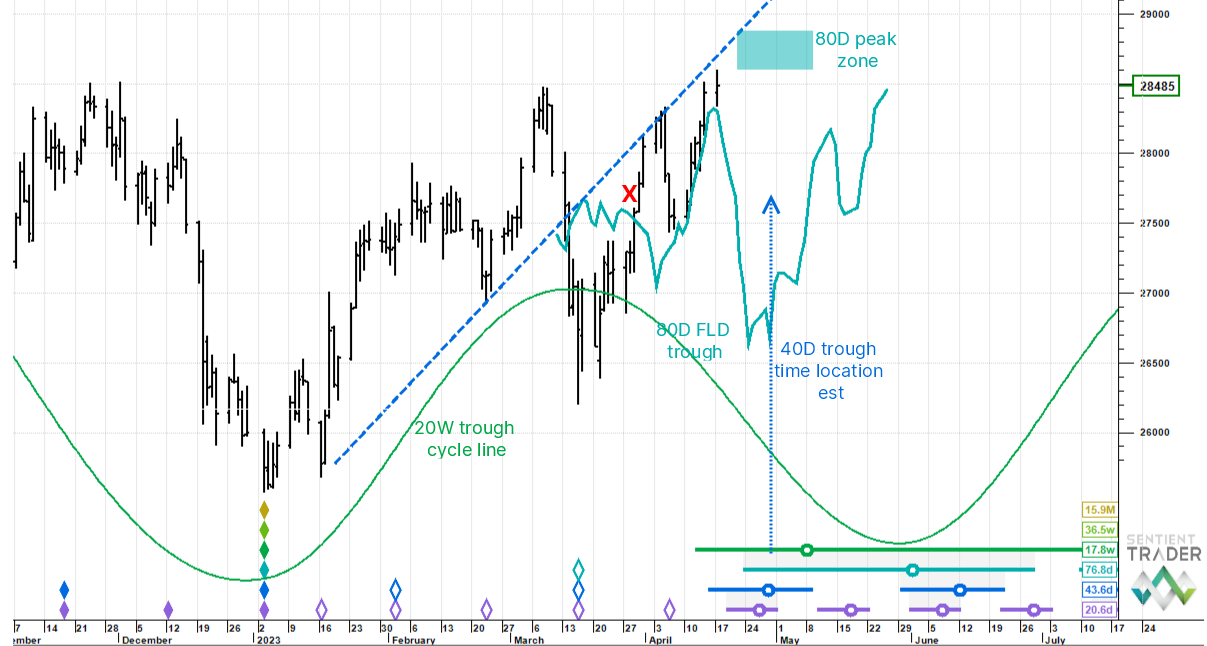
Current stance - peak zone likely.
The current 80 day cycle which bottomed mid-March looks to be in its end zone. The 80 day cycle FLD was crossed up by price at the end of March and projects to just under 28,900. If we get that far, then there may be a little more upside play from there, but price is starting to stretch and upside looks limited. You can see from the 20 week cycle trough line that this cycle is heading down and due to trough in the earlier weeks of June.
40 day cycle trough
The next 40 day cycle trough is due towards the end of this month or into early May. This should act as a downside magnet and any decline from the peak should be sharp to catch up to the cycle's rhythm.
Bitcoin - minimum 80 day cycle peak beckons.
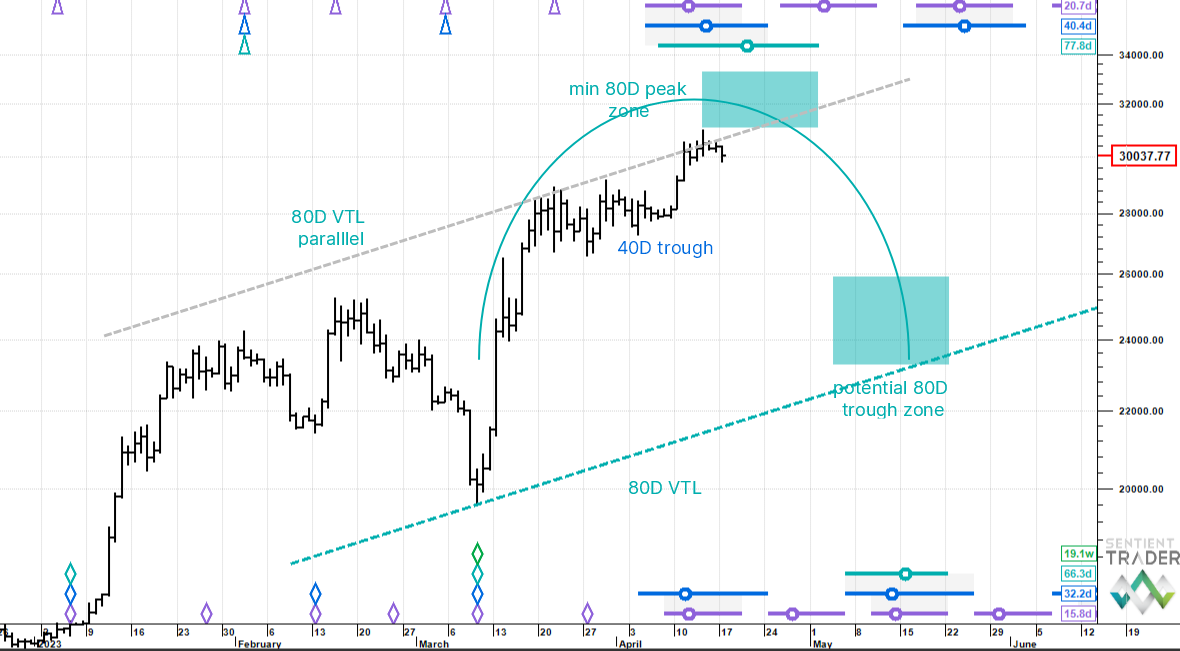
Current stance
In recent notes we have explored the possibility that price is running towards an 18 month cycle peak potentially up to 33,000. Scaling back the magnitude today, but with a very similar message, we are focusing on the 80 day cycle. There is a very clear cluster of peak circles above us now, which means that we are in a peak zone. The light blue 80 day cycle peak circle's whisker extends out to early May and the target box is quite deep. We are expecting a peak and then a meaningful pullback, but need more price action to get a better fix on exactly where and when. The preferred view right now is for a mini jolt higher before the sell off starts.