Macro outlook - 30 January 2023
Link to guidance notes for Hurst cycles terminology: FLD, VTL, Translation, Diamonds, Circles/Whiskers etc. Peak and trough zones are colour coded according to cycle magnitude in Hurst's nominal model.
We focus on a specific set of cycles in the notes, by wavelength: Long, 54 month and 18 month; Intermediate: 40 week, 20 week and 80 day; Short, 40 day and 20 day. The longer the cycle, the more significant the peak or trough and theoretically the stronger the move into and out of it.
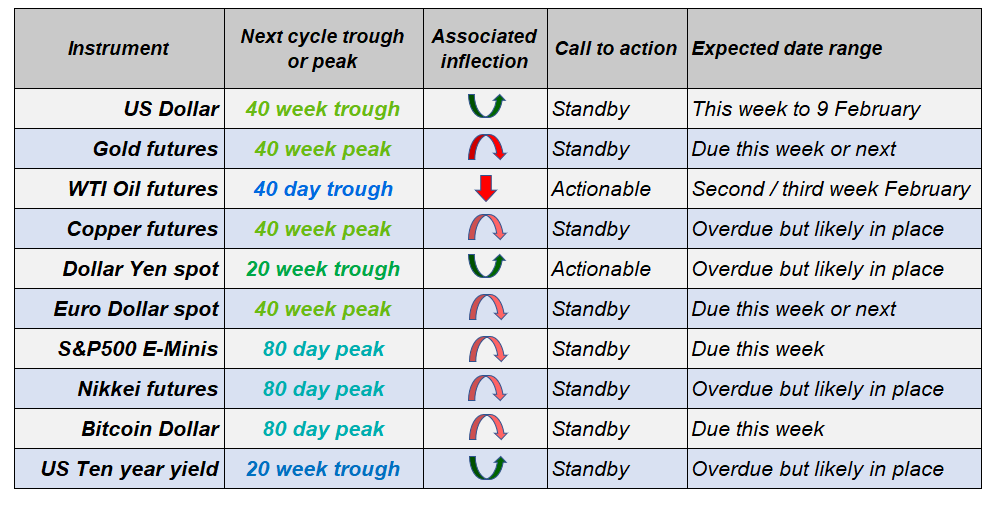
Dollar Index - a reassessment of the cycle phasing analysis creates a similar, but more compelling view of the next big cycle trough. Due soon and could result in the awaited rotation up.
Longer view to get bearings
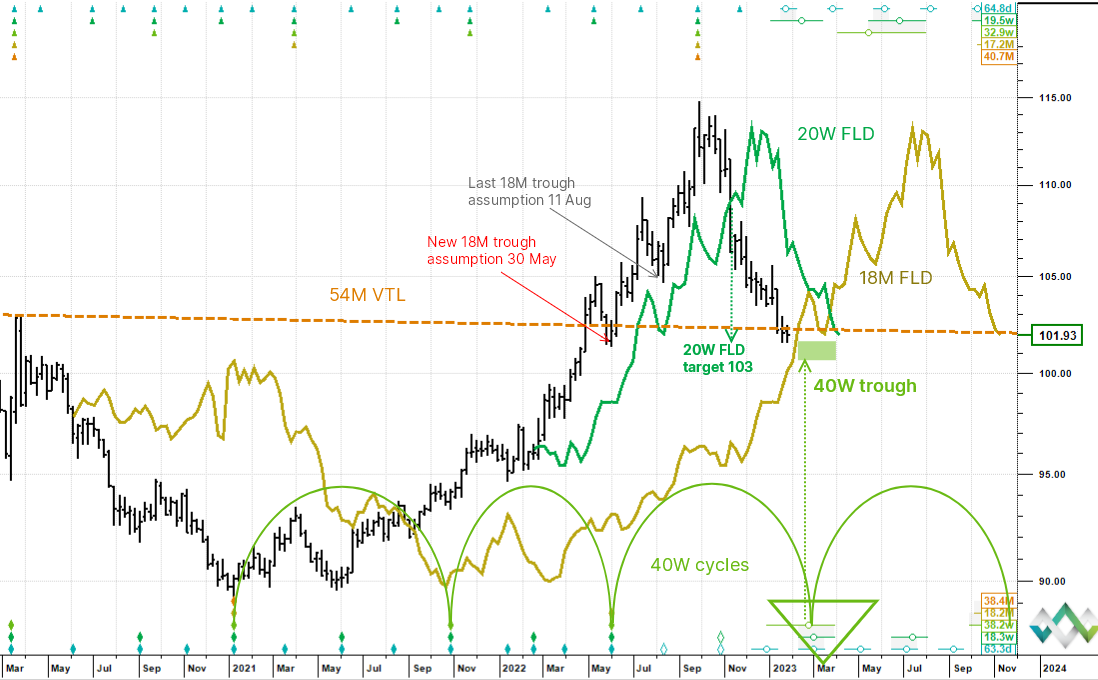
In last Monday's note we took a near term tactical view to track the "imminent" 20 week cycle trough, the assumption being that the recovery was due that week. Because the trough is nearly a month late now and still not confirmed, a bigger picture review is in order. Let's step back to a longer term chart and change the phasing of the 18 month cycle (phasing means putting diamonds at the cycle trough time locations).
Repositioning the 18 month trough
Up until now the working assumption has been that the last 18 month cycle trough was on 11 August 2022. However, suspecting something was off in the analysis, we tried the 18 month trough at the 30 May 2022 low instead: its a valid position and voila things make more sense. In fact, because the ostensible 20 week cycle has extended so much, its not even that radical a departure in terms of timing the next big trough. The average 18 month cycle wavelength is roughly the same in both views, but we now have an impending 40 week cycle trough to focus on. In terms of timing it could occur from this week. We should be able to zero in on this more as price action unfolds.
Price target cluster here
In terms of price, notice the confluence of potential support on the chart: the 20 week FLD downside projection to 103, the long term 54 month valid trendline and the 18 month FLD touch all in the 40 week trough timezone.
FOMC catalyst?
We likely have a little more time and price play, but the analysis is legitimate and the preferred view is Up. There will be an update this week if we start seeing an early rotation especially through the FOMC Tuesday/Wednesday. Note: if there is a spurt higher then a collapse, then it is extremely bearish, because it will mean that the 40 week cycle has flamed out straight away. This is not the preferred view, but its as well to know that the alternative is dire.
Gold - still targeting the 40 week cycle peak around key resistance circa 2,000 within the next week. Expecting a spike up finish to the November 2022 advance.
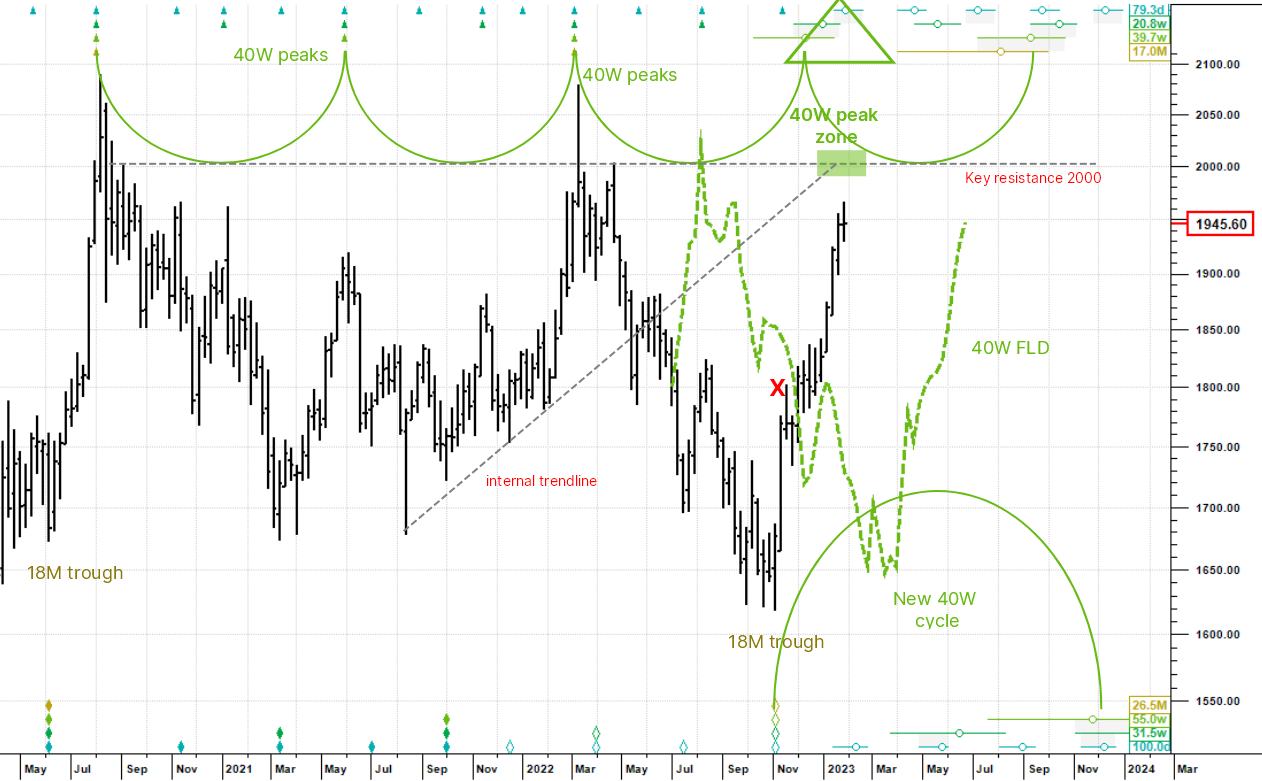
The 40 week cycle peak is still sucking price into it
Another longer timeframe analysis showing that the 40 week cycle peak is at hand. In situations like this, when we are convinced that a major inflection point is due, but its taking its own sweet time to get there, then rather than just keep showing tactical updates trading 5 or 10 day cycle fluctuations, we think it makes more sense to step back and then to remind everyone what we think is going on bigger picture.
Target level
The 40 week FLD was crossed up by price on 5 December at 1,819, which generates an upside projection just north of 2,000. The 40 week peak zone is directly above us now (peak circles at the top of the chart) and although the maximum time range is 13 February (that's the circle whiskers) there could be a fast move up to key resistance at 2,000 and the target to arrive on time.
Gold is peak directed
Gold is peak rather than trough directed, why this is no one is quite sure, but it is. Because the peaks are regular and show good rhythm and order, confidence in the view is higher. Gold's trading personality is also that price tends to spike into peaks and collapse rather than roll into them and then gently fall over.
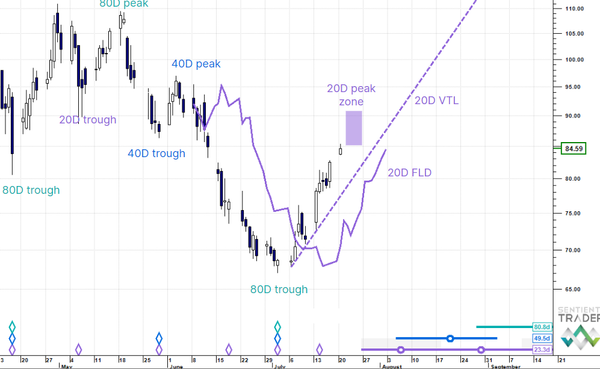
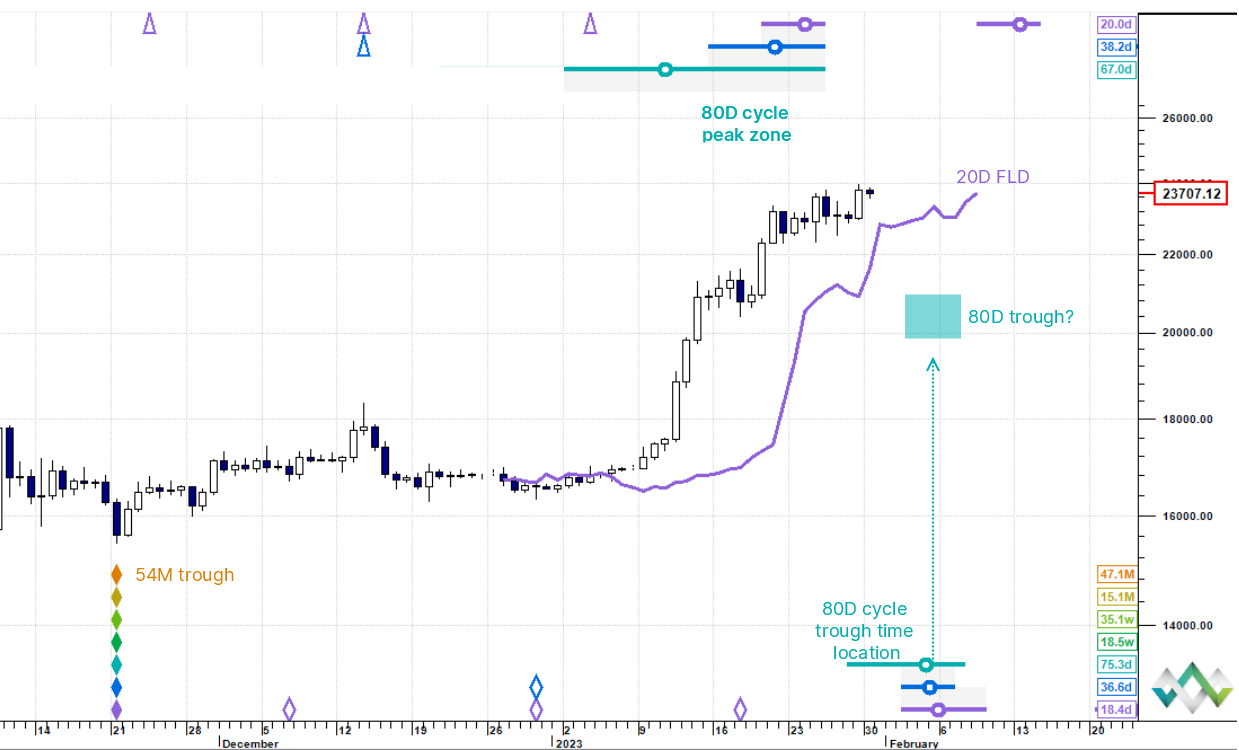
Oil (WTI ) - price is an 80 day cycle peak zone and rolling over toward second/third week of February target. The underlying trend however may have shifted upwards.
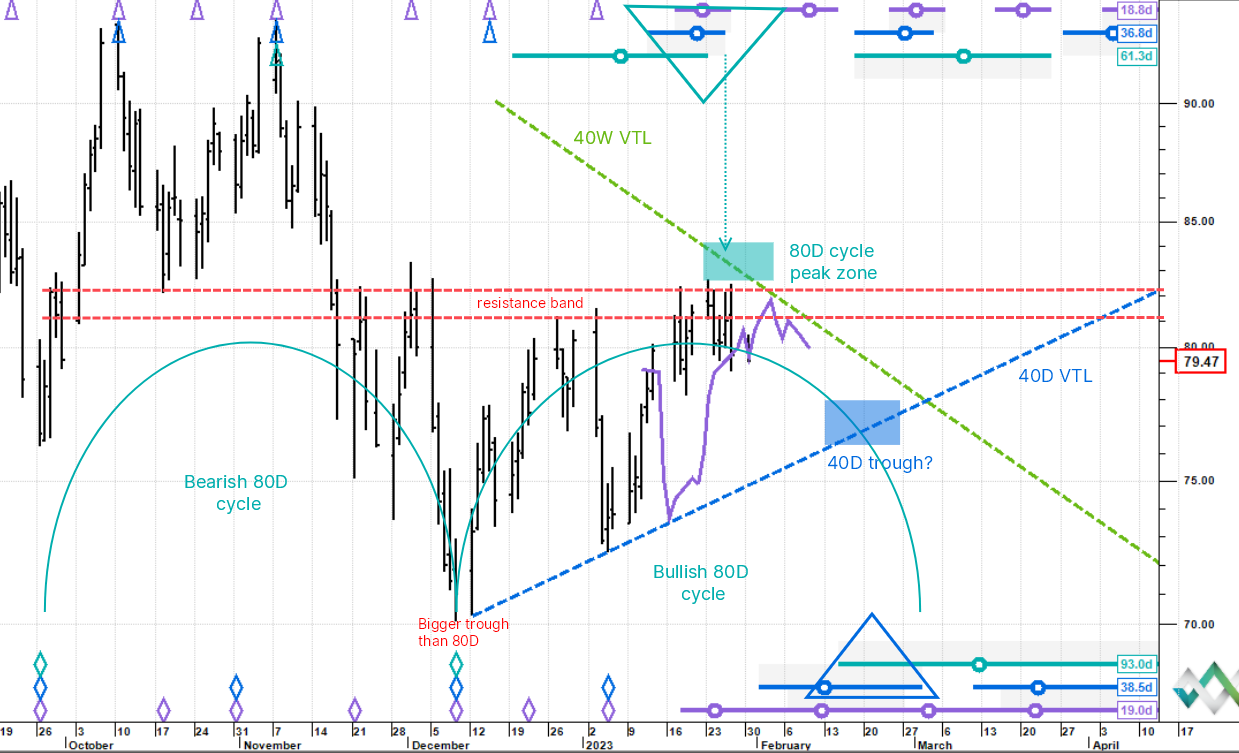
Rolling over at the 80 day peak
We are looking at the current 80 day cycle, which started up on 9 December and is next due to trough circa 13 to 20 February (we will be able to be more precise as price action unfolds). We look to be in the 80 day cycle peak zone here at a confluence of would be resistance and price is rolling over.
Next downside target
Price is testing the purple 20 day FLD (replica 20 day cycle offset forward in time) at the 20 day trough zone (purple circle at the bottom of the chart). We could see a brief push up from here, but because the 80 day cycle looks to have turned down and could now be a headwind, the 20 day uplift should be very muted. We anticipate a sell off which could carry price down towards the 40 day trough circa 76 circa 13 - 20 February (coincident with the 80 day trough).
Bearish and then adjacent bullish cycle points to a longer shift upwards
One observation about this analysis is that the current 80 day cycle's peak is strongly pushed forward in time (peak right translation), which implies a bullish undercurrent. Compare this to the last 80 day cycle whose peak was dragged back in time and experienced a sharp decline. The last cycle was bearish, this one is bullish, which means that the last 80 day trough marked a regime change of sorts and is therefore probably a higher magnitude cycle trough.
Copper - the 40 week cycle peak could be in place and the next downside aiming point is the 80 day cycle trough due in the second week of February.
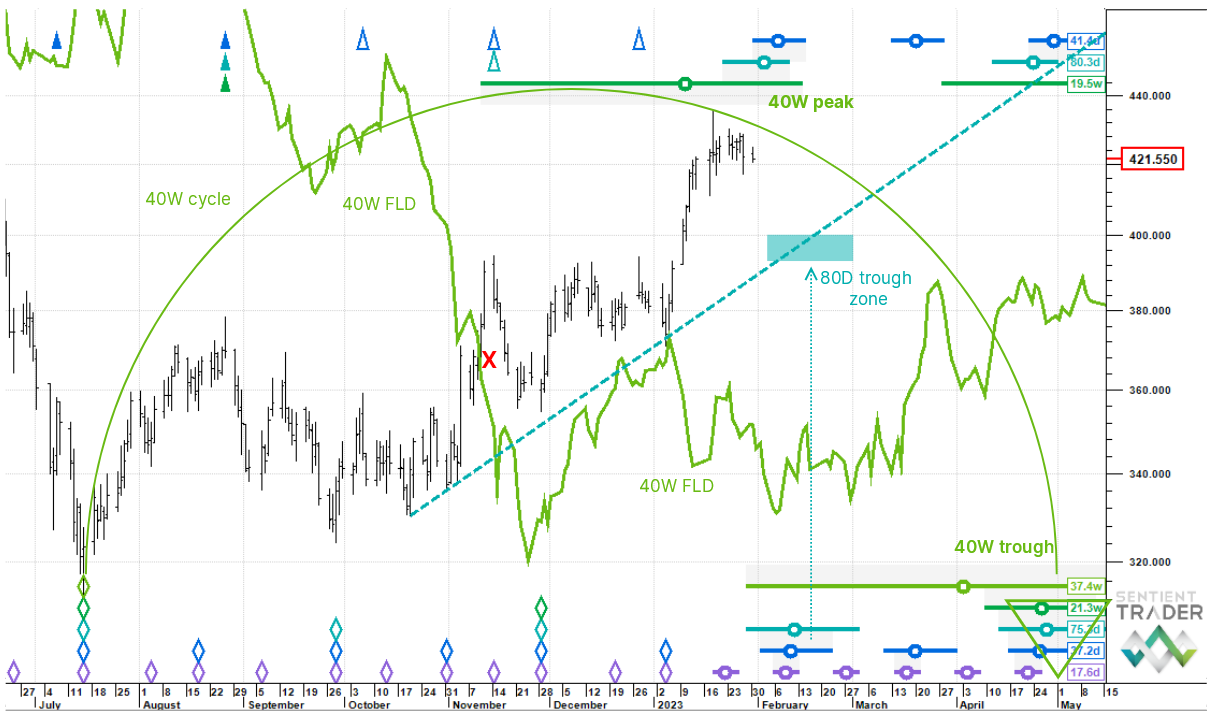
Rolling out of the 40 week cycle peak?
Stepping back again for the wider context, the 18 January high is still considered to be the 40 week cycle peak, which if correct skews risk lower basically until May - but with a likely countertrend bounce from next month. To demonstrate the power of the FLD, the 40 week FLD was crossed up by mid-November and projected to 433. The actual high just came in at 435.
Aiming for the 80 day cycle trough
The next downside aiming point is the 80 day cycle trough, which is due from the second week of February. An 80 day VTL has been plotted (the valid trendline associated with the 80 day cycle) and intersects the trough zone at around 396. This should lead to a bounce, but with a falling 40 week cycle burdening price, we are not optimistic that it will be especially profitable on the long side.
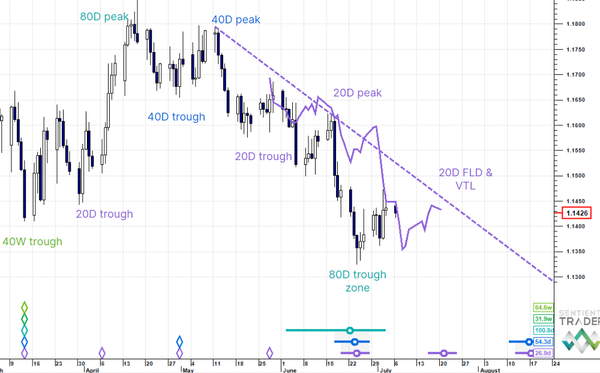
Dollar Yen - the 20 week cycle trough came in almost exactly on target and we are waiting for the 131 level to yield to confirm it. For now, trading the 20 and then 40 day cycles higher.
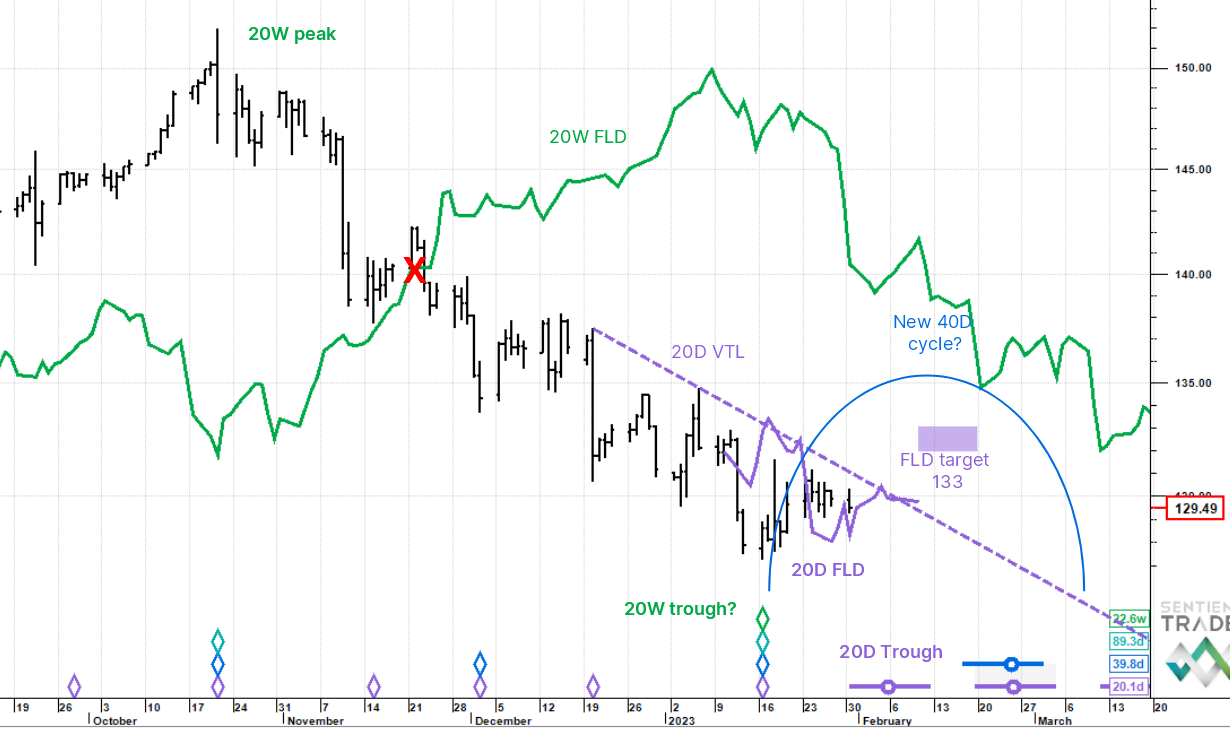
20 week cycle trough in place?
It seems increasingly likely that the low of 16 January was the 20 week cycle trough. It has come in 23.9 weeks after the last 20 week trough (2 August 2022) or 1.3 weeks longer than the recent average wavelength. It has also come in pretty much at the projection generated by the 20 week FLD price cross last November (128.7). Another thing to note is that the 20 week FLD is now falling in future time, which implies that price rises to meet it.
The 20 day FLD
The first cycle out of the purported 20 week cycle trough that we care about is the 20 day cycle. The 20 day FLD has been crossed up by price and projects to 133. The 20 day VTL is the purple down sloping valid-trendline associated with the 20 day cycle and when price crosses up through this at circa 131, it means that the 40 day cycle must have troughed and by extension confirms that the much longer trough (the 20 week) is in - 131 is the level to watch and the preferred view is a push higher into the 40 day cycle peak, but first we need a shallow pullback into the 20 day trough before 6 February.
Note: you see the most recent price up cross through the 20 day FLD out of the 80 day trough .. and then the pullback towards the 20 day trough and now the promise of an decent upside leg? Well, this is a "thing"... they are the start moves of an 8 part sequence called the "FLD Strategy" and here we saw the "A" (up) interaction and likely the current "B" down interaction setting up for the "C" advance. This system runs across the entire 80 day cycle and the final FLD interaction leads to "H" down into the next 80 day trough. It is very interesting and powerful and we will start talking about it more..
Euro Dollar - probable end zone. The 40 week cycle peak zone is still upon us, we are near the target and a 20 week trough is due lower in two weeks time.
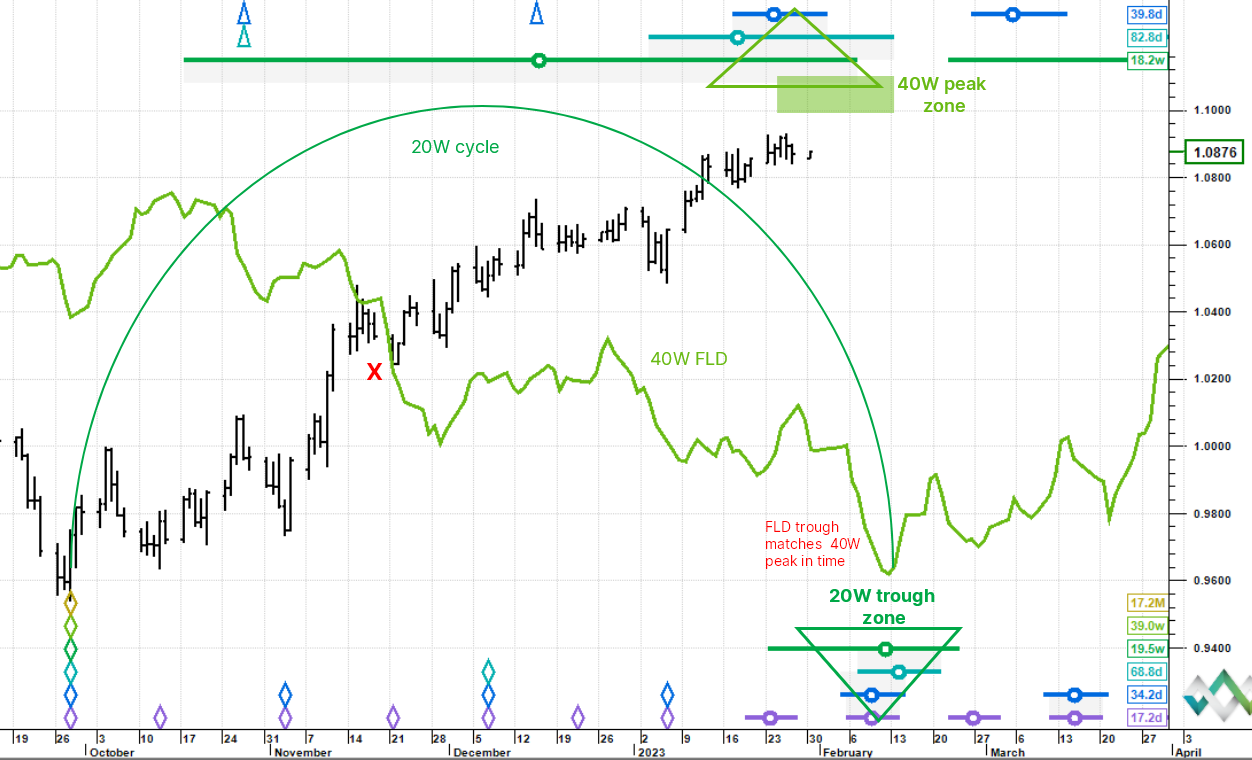
High magnitude cycle peak re-emphasised
At the risk of being dull, all we can do here is reiterate the ongoing call that price is in a high end-zone cycle peak. In last week's note we again referred to the very clear 20 week cycle trough zone due in mid-February (the 20 week next of lows stack of future cycle trough circles), and a meaningful downside magnet once the current advance tops out.
FLD upside projection of 1.10 is close
Last week it was also reiterated that the 40 week FLD upside price cross on 21 November 2022 gives an upside projection of 1.10. And if you look at the estimated future peak circles at the top of the chart, they are stacking nicely indicating a long magnitude peak. The top out process may have started but to be on the safe side lets aim for this week or next.
Sharp but probably shallow sell off needed to get to next big trough on time
Now because the expected 20 week cycle trough is only two weeks away, a decline out of the top will need to be very sharp to catch up to it. The peak is also very late in the cycle (peak right translated) which points to an even longer underlying uptrend. That would be the 18 month cycle rising which is only 17 weeks along from the trough at the end of September. Note: just because the trough zone is marked at the bottom of the chart, it does not mean price is going all the way to the bottom of the chart - just saying.
Sometimes we are asked why we don't provide super precise price targets, stop levels and exact timings for coming peaks and troughs every week. First, its very difficult to do this exactly and if we get it wrong we get trolled mercilessly; also we cannot accommodate everyone's trading time horizon. Second, the value we are trying to add for our subscribers is our best estimates for a cyclic road-map at any given time. So if we say a "20 week trough is close" for example, and a fair amount of work goes in before we utter these words, you can start short selling with extreme prejudice if you like, but we are simply saying "that would be imprudent now". Our mission is to help stop you from buying into upcoming peaks and selling into upcoming troughs.
S&P 500 E-minis - difficult analysis, because according to the big cycles, price should be plummeting. However, we still have an upside target at the mid December 40 week peak level..
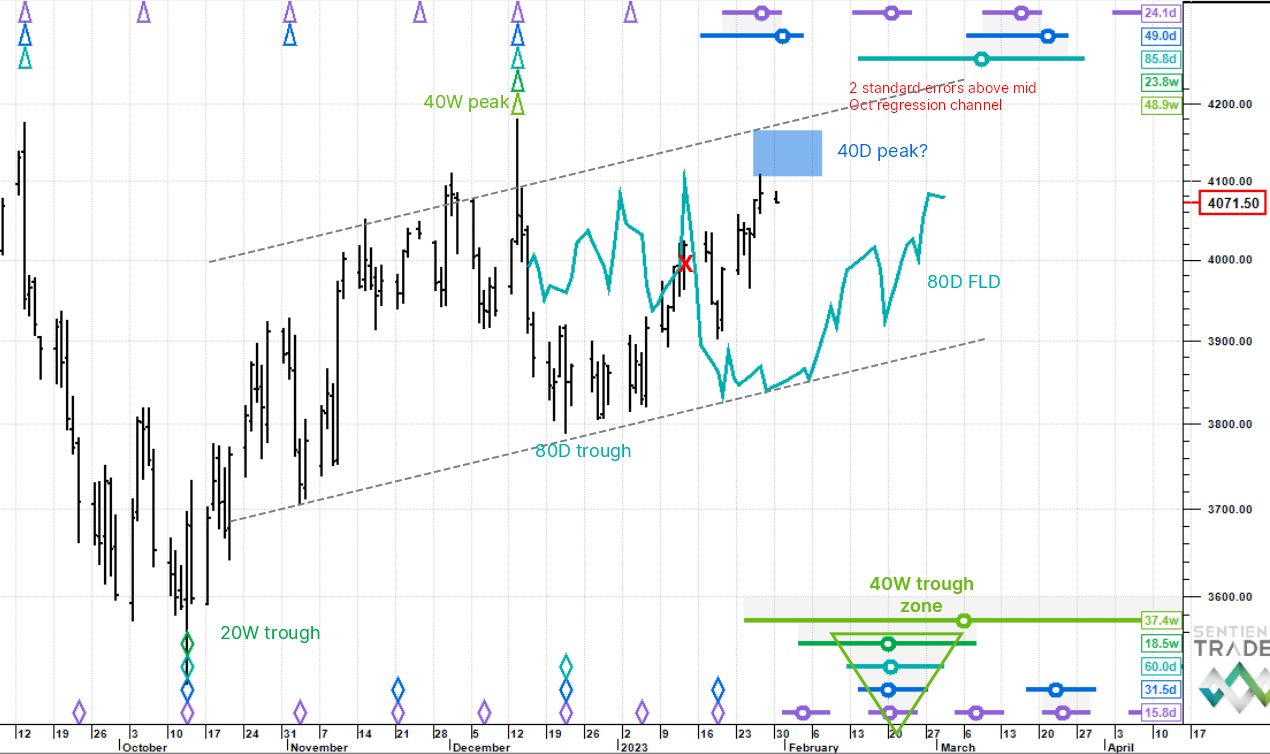
Entire price structure should be falling hard and yet...
SPX E-minis is hard this week. Sorry, it happens. But we'll soldier on and will update if the clouds clear this week. The December peak was that of a 40 week cycle and the end February trough should be a 40 week trough. So everything should be falling like a stone with a big cycle downswing ... and yet we have this punchy rally still going on.
Upside target could fall short
The 80 day FLD was crossed up in early January and gives an upside target of 4,183, which is actually 3 points higher than the 40 week peak (13 December), which is highly improbable. So we think price will fall short of the target as one would expect with a strong underlying down trend. Any pullback will need to be sharp because the big downside magnet (the 40 week nest of lows) is due in a few weeks and price will have to race to get there on time.
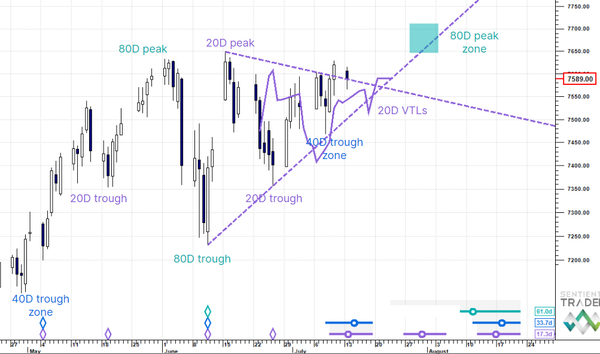
Nikkei futures - may have hit 80 day cycle peak and resistance and the underlying trend looks to be down, acting as a tailwind.
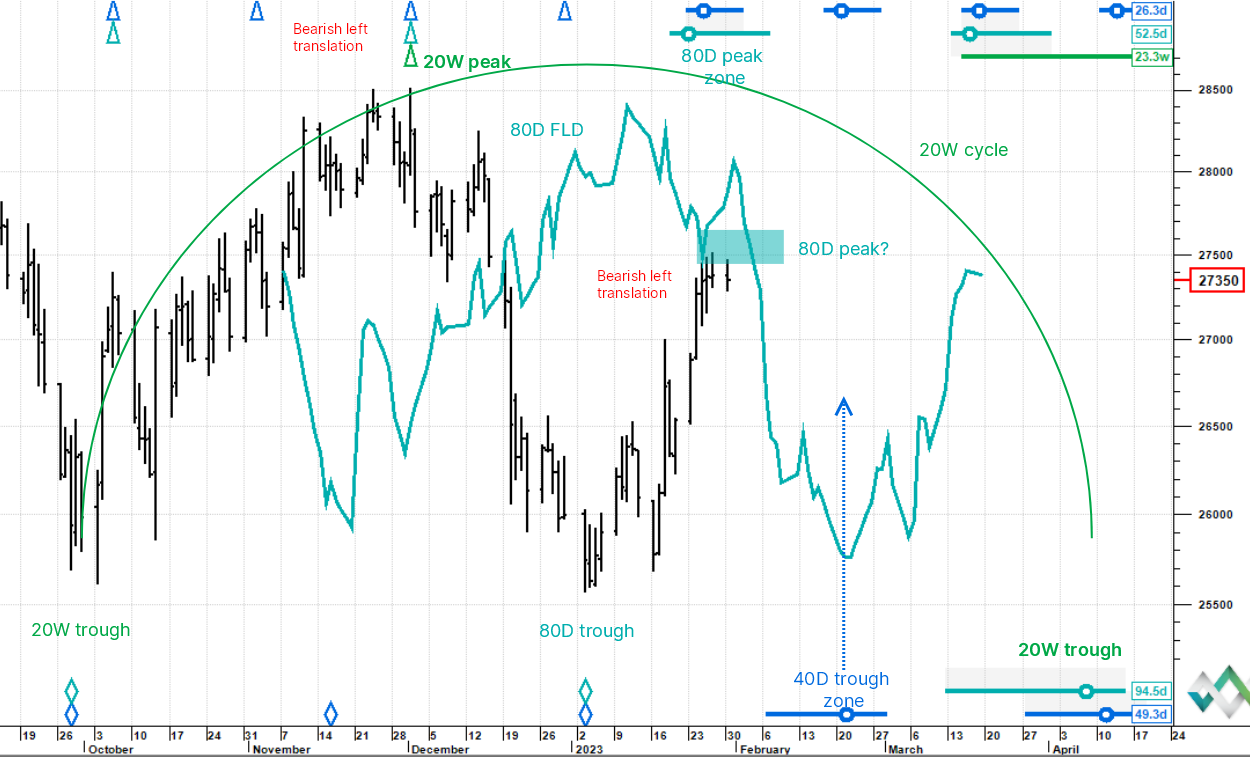
Bearish 20 week cycle informs shorter cycles
The arc of the 20 week cycle has been plotted from last October's 2022 start to the expected next trough in the second week of April. The average wavelength of this cycle is 21.7 weeks and yet the peak came in (1 December 2022) after only 62 days. This is a big peak left translation (came in early) and is very bearish longer term. Our view is therefore is that the current rally is fighting a headwind.
The 80 day cycle may have hit resistance
The current 80 day cycle (there are two in a 20 week) bottomed on 1 January, took off in style, but has touched the 80 day FLD in the time location for the 80 day cycle peak. Typically this means resistance and the 80 day turns down. And if it does turn down here then this cycle too is heavily peak left translated (came in after only 24 days in a cycle that should be 95 days trough to trough). Early peaks are bearish, they imply a longer downtrend is squashing the cycle's amplitude).
Next aiming point lower
Intermediate term the 80 day cycle has to trough at the same time as the 20 week cycle (Hurst's principle of synchronicity) and this big cycle is a downside magnet - the 20 week cycle is falling). A 40 day cycle trough is due around 20 February and this is the first downside aiming point for now. We should be able to get an angle on a price target this week.
Bitcoin - potentially we just had a rapid fire 80 day peak / trough sequence, but preferred view is still for a pullback into the 80 day trough due circa 6 February.
The next 80 day trough is close
There is a bit of conflict in the analysis, but here goes. There is a super neat stack of expected trough circles at around 6 February marking the very likely position of the 80 day trough. We expect a sell off alongside equity indices, but it will need to be sharp to find the 80 day trough on time. However, because the underlying trend is fiercely up (54 month cycle trough came in just 70 days ago), we are not looking for too savage a pullback - maybe to the 20,000 handle.
Did the 80 day peak trough sequence already happen?
The question however is this: did the 80 day cycle peak and then trough early with just a two day pullback (very short due to the strong uptrend in the background) and are we now marching ever higher? Its feasible, because we have fallen outside the range of the 80 day peak whiskers at the top of the chart, but we think its a lower probability. If there is a huge push up from here though, not the preferred view, then we will send an update.
US Ten year yield - potentially in a major cycle trough zone which we will attempt to navigate through using shorter cycles and cycle tools. Preferred view: Up and away.
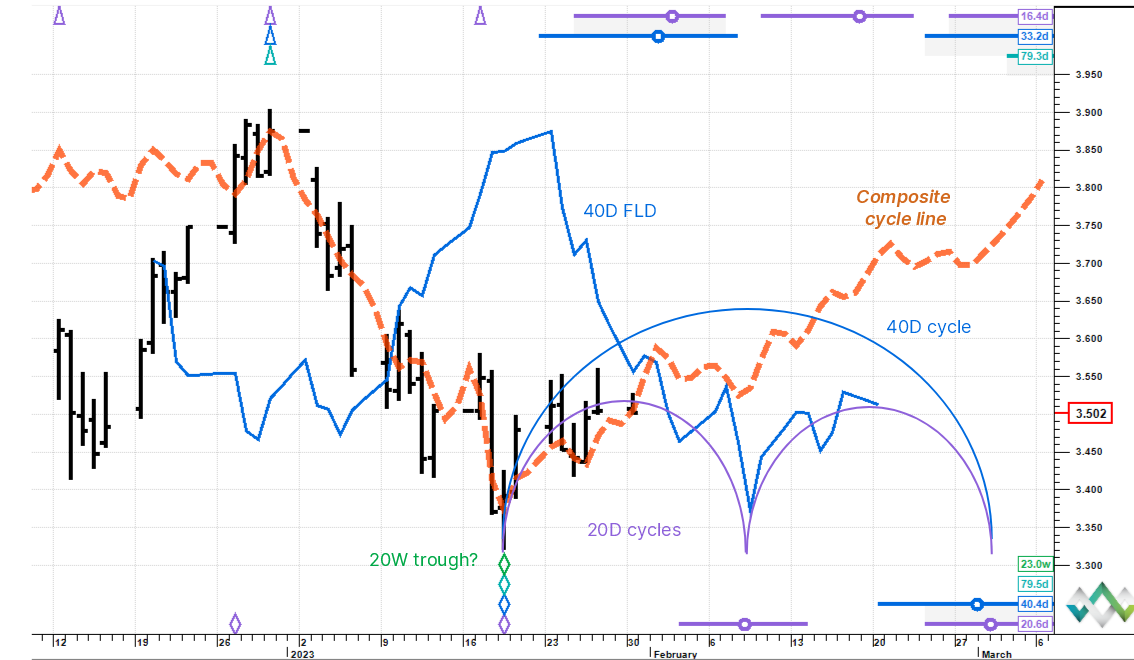
From longer term to tactical view
We put out a longer term analysis last Friday in which the case was made for a meaningful advance (read that post here). Pulling back to the tactical level now, price looks to have formed a 20 week cycle trough (but actually probably a 40 week trough too as per the long term note) and has started rising out of it. The composite cycle line is the theoretical synthetic of all cycles operating currently and is rising.
Next aiming point and beyond
The next aiming point within the first 20 day cycle is the 40 day FLD, the blue replica 40 day cycle line. This could easily act as a near term barrier and repel price back into the 20 day trough zone due from 3 February, but if price clears it to the upside, then we have a clean projection up towards 3.7 and the 40 day cycle peak. Big troughs are usually challenging to navigate through as there tend to be shenanigans, but we are tracking closely.