Macro Outlook - 6 March 2023
You will come across specific terms in these notes (FLD, VTL, and so on). Rather than explain them each time, you will find definitions here: guidance notes for Hurst cycles terminology Note: we have abbreviated the text in response to your feedback (since our subscriber base has expanded dramatically, more non-Hurst specialists have come on and feedback has favored the abbreviated text).
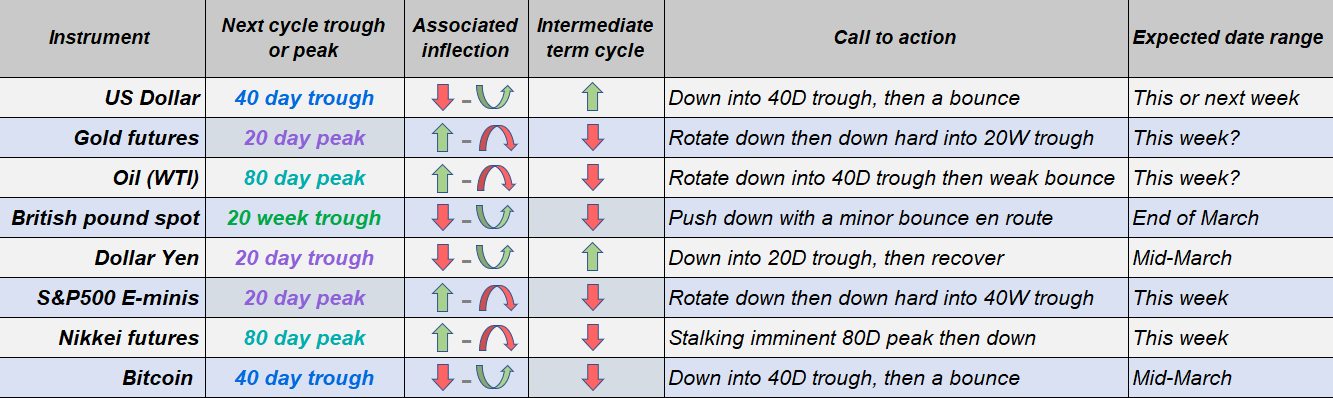
Dollar Index - the 40 day cycle peak came in as forecast and the 40 day trough is now due. Near term looking for a short duration decline and then a reversal up.
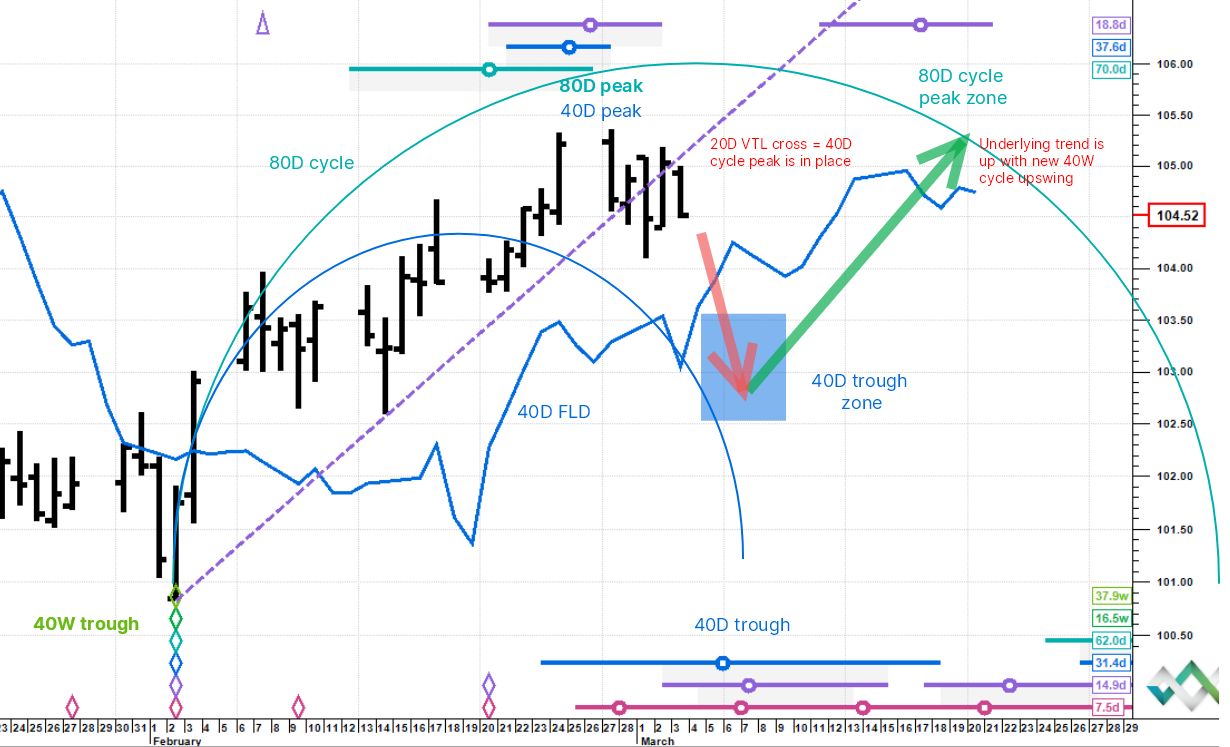
- With a new 40 week cycle rising from the early February trough, the underlying trend is up. which in the intermediate term implies shallow pullbacks and higher lows and highs in each cycle.
- The 80 day cycle peaked on 27 February together with the 40 day cycle which we called for in last week's Macro Outlook.
- We are therefore looking down into the coming 40 day cycle trough which is due between 7 and 15 March. For now we expect the downside limit to be in the 102.5 / 103.5 range.
- Once the 40 day cycle trough is in place, a second push up towards a new 80 day peak occurring in early April is expected.
Gold - the 20 week cycle trough is likely still ahead. Price looks to be about to top out with the last 20 day cycle peak and start declining.
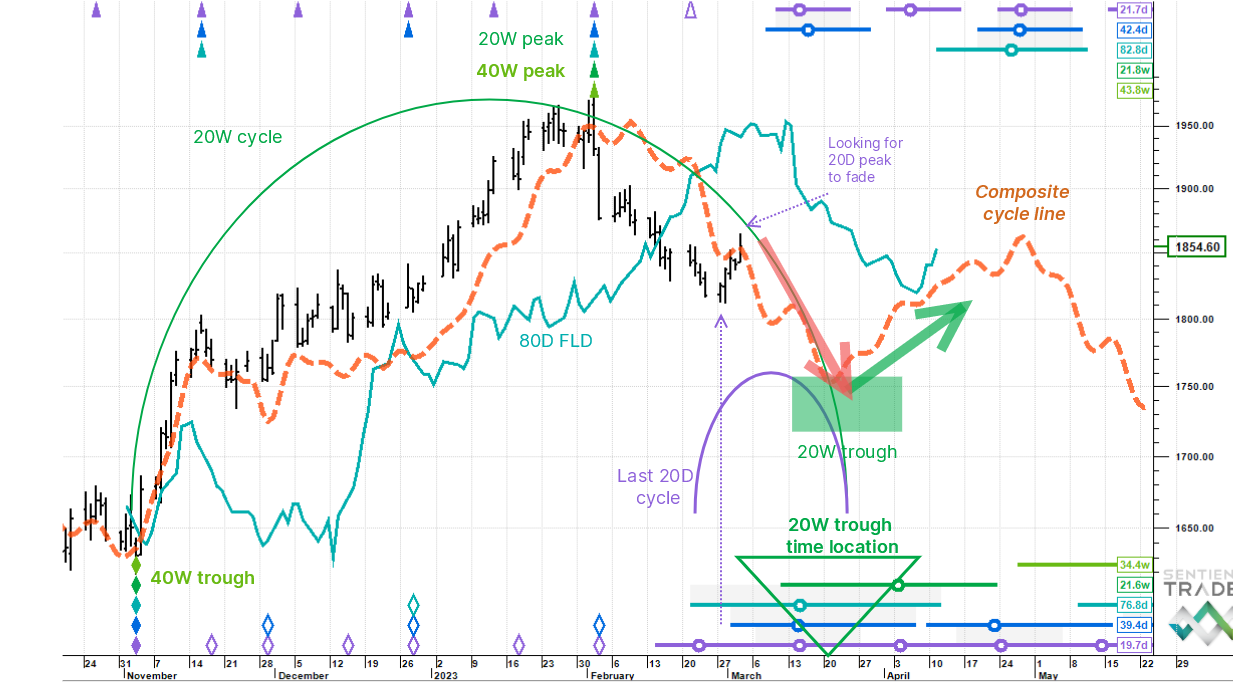
- A 40 week cycle peaked on 2 February and the 40 week downswing is still generating intermediate term bearish pressure.
- There are two 20 week cycles in a 40 week cycle and the next 20 week trough is due roughly between 15 March and 4 April. However we are expecting the trough around 21 March.
- We think that the recent bounce in Gold, coincident with the drop in the US Dollar, is just the upswing of the last rising 20 day cycle in the 20 week set - and as a matter of interest there are eight 20 day cycles in one 20 week cycle. The peak is due soon and the call is to fade for a downside continuation.
- The 80 day FLD was crossed down mid-February and the downside projection is 1,745. We could see an extension lower as the longer 40 week down cycle is the tailwind. Remember too, that the 20 week trough contains the 80 day trough and so the 80 day FLD projection is actually calling the 20 week low.
- I have plotted the composite cycle (dashed orange line). This is a synthetic line comprising the status of all cycles in the nominal model, from very long to very short and provides a loose road-map - be advised, these lines can shift around as price actions unfolds.
Oil (WTI) - 80 day cycle peak is due any time now. Chaotic, congested price action suggests a downtrend consolidation. Preferred view is reverse down shortly.
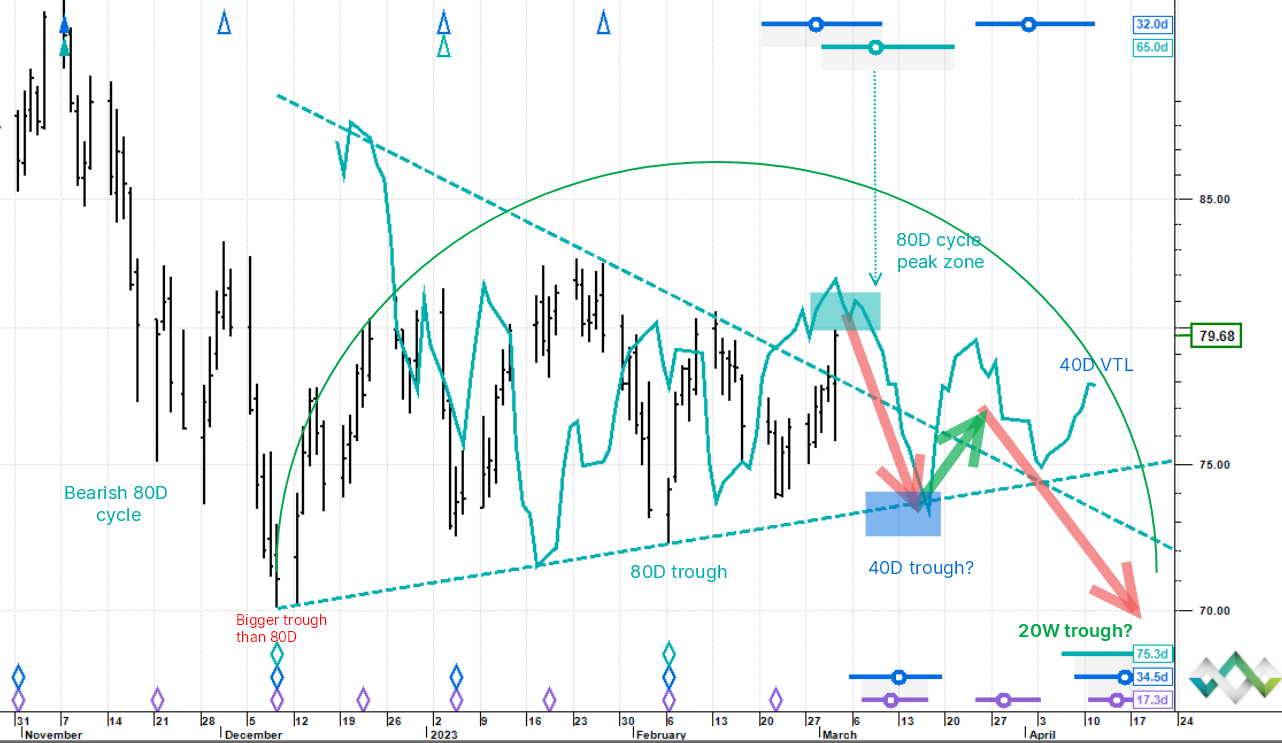
- Oil is still fiendishly difficult to analyse, but when that is the case it is often that price is in some sort of broader, choppy consolidation. Which begs the question what is being consolidated?
- What was happening before the congestion began was a steep price decline. So we are going with this idea: "consolidation of the prior decline and then back down". Consolidations can also take their own sweet time to end, but here is the view for now:
- The two light blue converging lines on the chart are 80 day cycle valid trendlines (VTLs). They have been funnelling price in a loose triangle pattern and we just had an upside breakout, which could actually be a failed break and mark the end of the pattern from last December.
- Price is in the 80 day cycle peak zone and has powered into the 80 day FLD and quite often in a peak zone this acts as a barrier - also note the mini head and shoulders top in the FLD. If price does fail here then the preferred view is that it shoots down to the lower 80D VTL barrier at the 40 day cycle trough due around 12 March and circa 73.4.
- A reaction higher is then expected but a longer cycle trough (the 20 week cycle) is due mid-April which should act as a strong downside magnet.
British Pound spot - stalking the 20 week cycle trough. The broad underlying trend is down and the preferred view is also down across March.
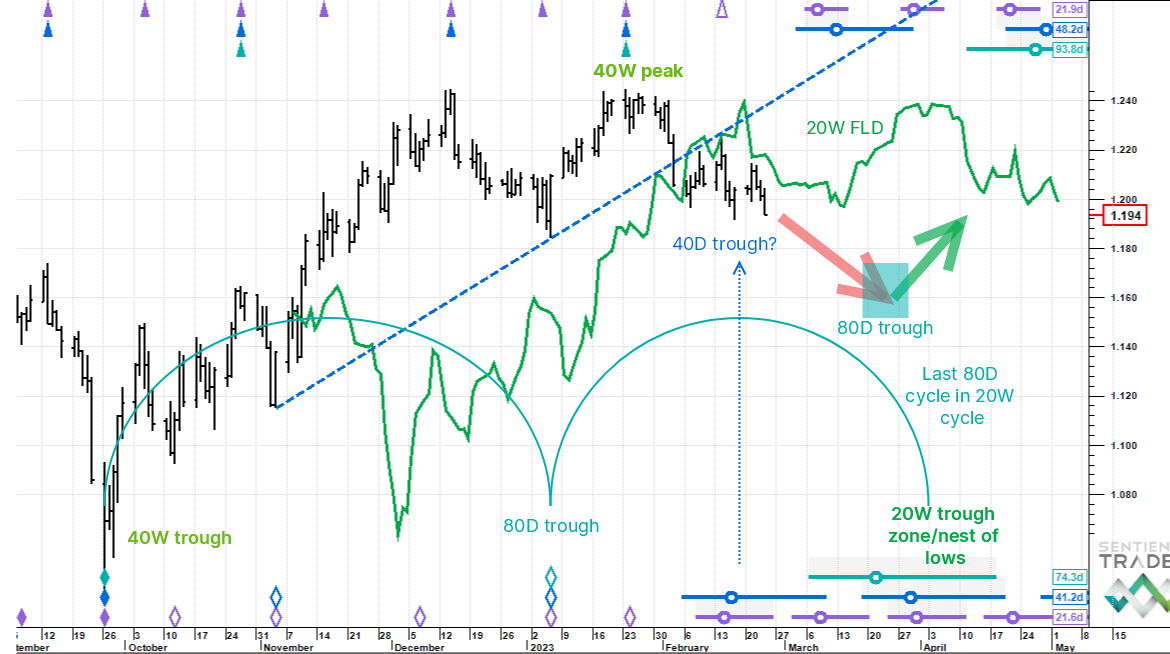
- A 20 week cycle nest of lows is due at the end of the month and the 20 week FLD cross downside projection is 1.17. This target might extend lower because the 40 week cycle turned down at the end of January and is still a tailwind.
- One thing to note for broader context is that the 40 week peak came in after 17 weeks, which is only 42% of the expected wavelength of this cycle. We would say the peak is left translated therefore, in other words early, which has longer term bearish implications.
- There is a slight question mark over the placement of the 40 day cycle trough on 17 February, but the working assumption is that this is a correct placement and as such we are not expecting a counter-trend uplift here.
Dollar Yen - the 20 day cycle may have just peaked. The broad underlying trend remains up but the preferred view near term is shallow down into a 20 day trough.
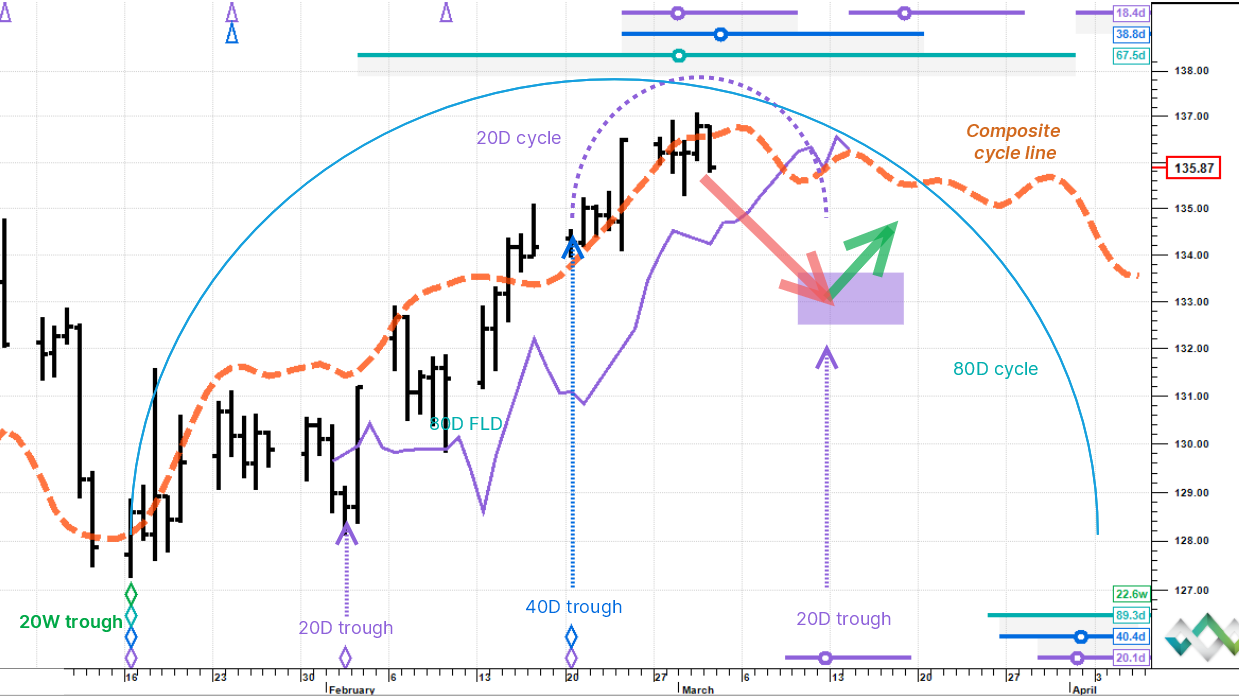
- The 16 January low was a 20 week cycle trough and this cycle is still young and rising - the underlying trend is up, in common with the US Dollar index.
- The 40 day cycle put in a straddled trough on 20 February and we were looking for a peak in the fluctuation of a 20 day cycle in last week's note. Straddled means that the trough is unclear and sits across two lows, oftentimes over a weekend. Note: Hurst cycles run in calendar time, that is why we see time gaps in the chart.
- The peak is not confirmed yet but it is looking like it is in. The actual confirmation would be a down cross of the 20 day FLD around 134.7.
- The next 20 day cycle trough is due around 12 March. This should lead to a bounce but the composite cycle line is showing a roadmap for generally suppressed prices until the first week of April when things should perk up again.
S&P500 E-Minis - a 40 week cycle trough is due in around two trading weeks, but price has rallied near term. Looking to fade the recent strength.
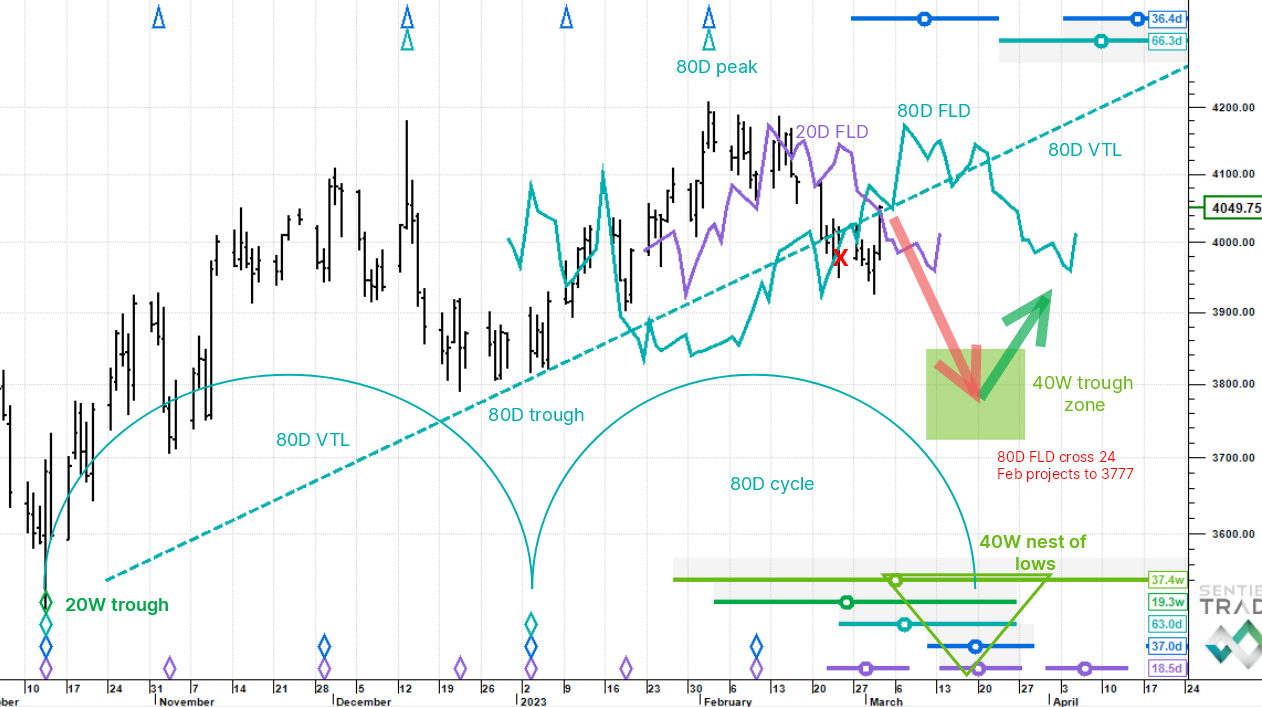
- I put an update out last Wednesday looking for a direct downside continuation towards the 40 week cycle trough due circa 11 March and said that the 40 week cycle's status is hard down and acting as a price tailwind.
- However, last Friday price shot up to 4,049 having already breached 4,000 to the downside on Thursday. The question therefore is: did the 40 week trough come in early last Thursday and are we therefore in the early stages of a big rally? We think probably not.
- The original downside target of 3,777 was generated by the 80 day FLD down cross on 24 February and in the chart you can see the somewhat scattered 40 week nest of lows, but with the 20 day cycle and 40 day cycle trough circles centred around 20 March. We think this is a more likely target timezone area for the next big trough, which would mean it is still ahead of us and near term bearish.
- The bounce last week could very well be an oversold, short cover leap out of the last 20 day cycle trough and as such could be close to peaking out and a potential rally fade candidate.
- Price has also powered straight into a confluence of potential resistance: the 20 day FLD, the 80 day FLD and the 80 day VTL. It looks like a risky call after such fast move, but we are going with it.
Nikkei - nearing 80 day cycle peak zone. Next 80 day trough is due early April, expecting a top out shortly and then sharp decline.
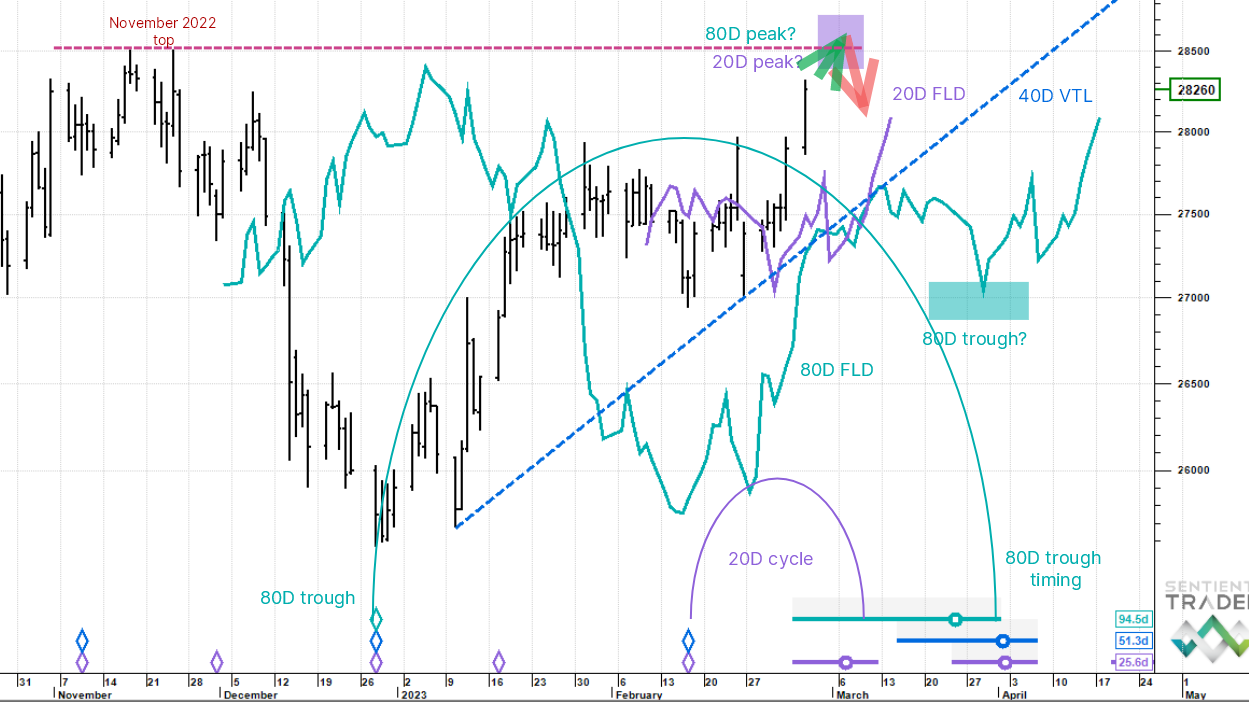
- In keeping with the SPX E-Minis view, Nikkei futures also bounced hard last Friday in what we think was the upswing of the second-to-last 20 day cycle in the 80 day set.
- The next 80 day cycle trough is due in the first week of April, so the call is for a down rotation potentially at the November 2022 top circa 28,500 and change.
- The analysis suggests that a 20 day peak is at hand (also therefore the heavily right translated 80 day peak) and that a reset lower is due. This should be staggered thus: first the 20 day cycle, quick down and up, retest and then straight down. So far the entire structure looks to be 5 wave impulse move into the current final, frisky wave 5 up.
- We are looking to fade the peak and then the preferred view is down into the 80 day trough in the first or second week of April just below 27,000. We will update and zero in more as future price action permits.
Bitcoin - nearing a 40 day cycle trough. Down near term, then prepare for potentially weak bounce.
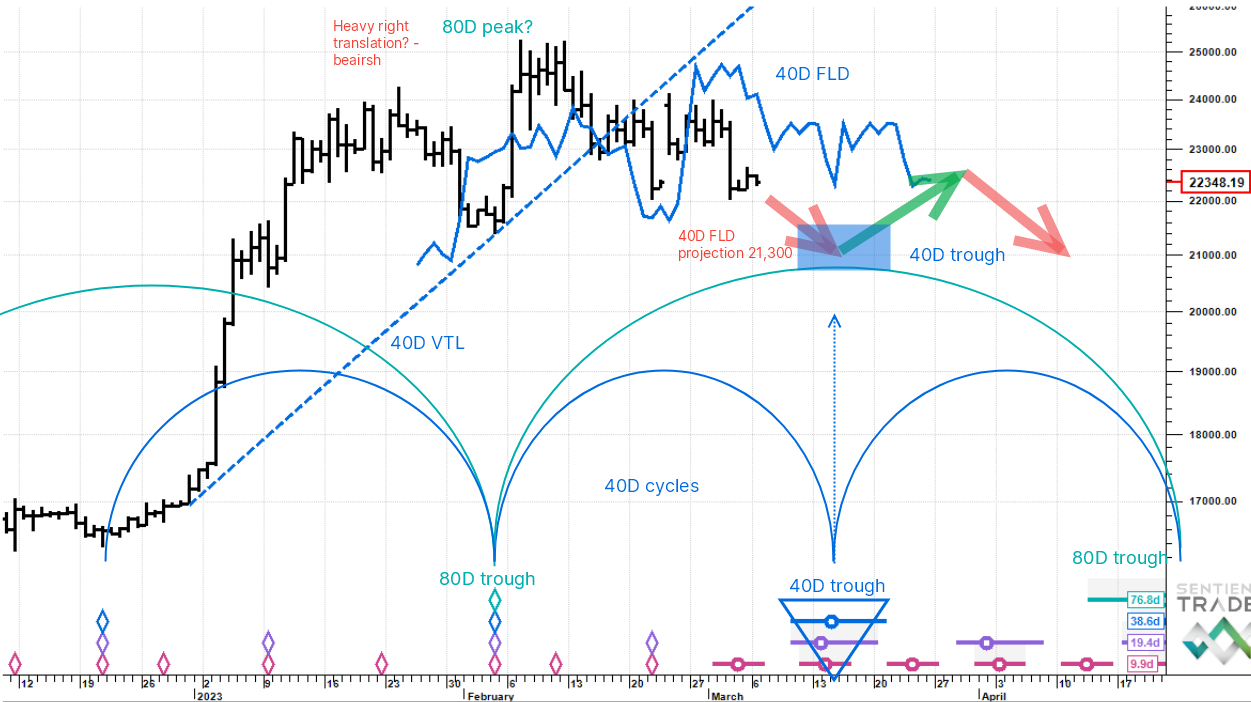
- Near term we are looking for a 40 day cycle trough from 15 to 20 March.
- There is a downside projection generated by the 40 day FLD down cross 1,000 points lower.
- The question mark in this chart is: did the current 80 day cycle top in early February? If it did, then it is heavily left translated, which is intermediate term bearish (the next 80 day trough is not due until the end of April). If the 80 day cycle peak is still ahead of us, it will show up in the strength of the move out of the next 40 day trough. We should have a better idea by then, but for now the call for more near term weakness stands.