US Large Caps in Focus - AAPL-, GOOG+, CSCO- (8 January 2026)
Notes: we tend to focus on inflections on the weekly data level to strip out noise and, hopefully, call trades of more meaningful longevity. The basic system is a dynamic heatmap and colours: Up as Blue and Down as Red. Momentum is woven into the price series, such that paler colours represent lessening of power and stronger colours, increasing power. The sub-window shows the heatmap with momentum numbers at each timeframe from hourly to monthly.
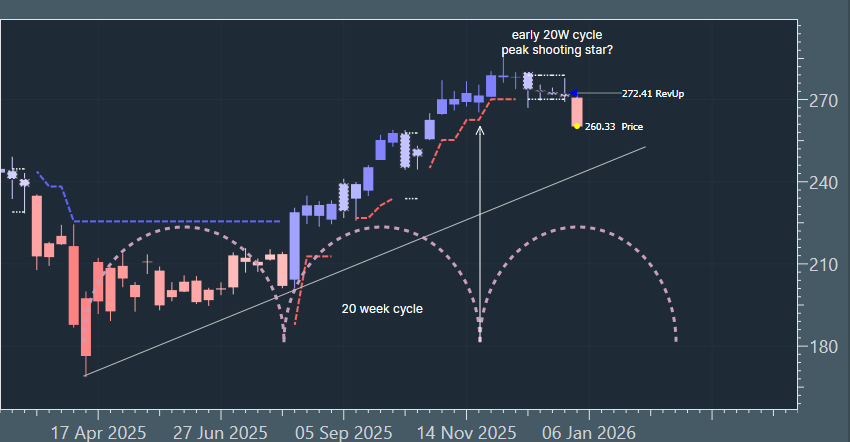
Apple Inc. (AAPL) - breakdown.
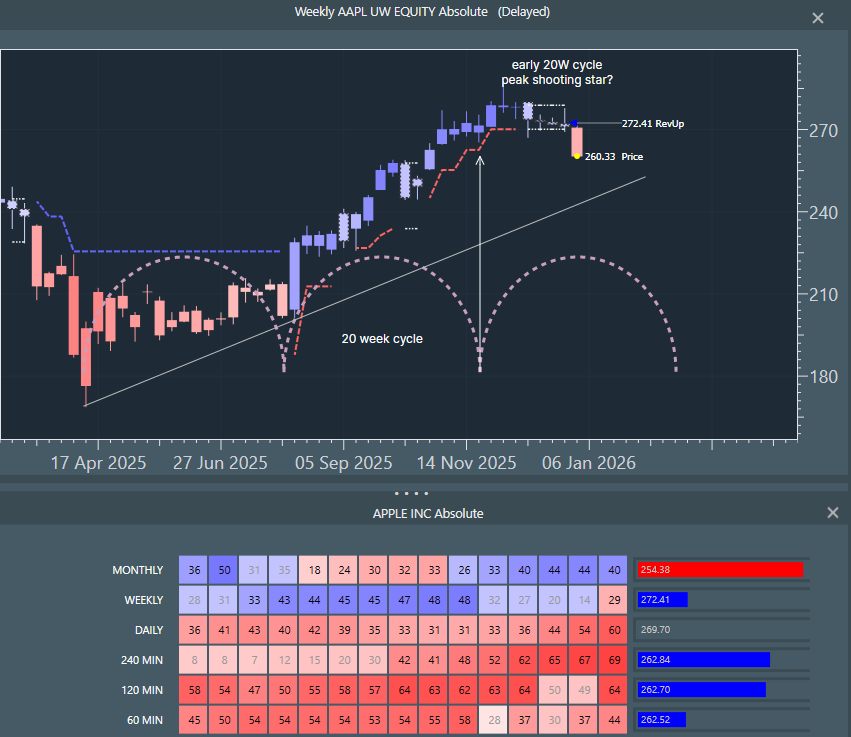
The multi-timeframe window shows a weekly breakdown to red coming out of a failed consolidation for four weeks (grey blues). All lower timeframes are accelerating reds (higher momentum numbers and stronger reds at last cell). There is a 20 week cycle rhythm in the data and we believe that the last 20 week cycle trough was 21 November. We had a couple of sessions up and then a shooting star and a rollover. This means that this quite long cycle peaked early, which is bearish. The next trough of the 20W cycle isn't until mid March, which implies that any rallies henceforth would be counter-trend and fail. There is potential uptrend support circa 253. We are expecting a bump and failure here.
Alphabet Inc. (GOOG) - popping out of consolidation phase.
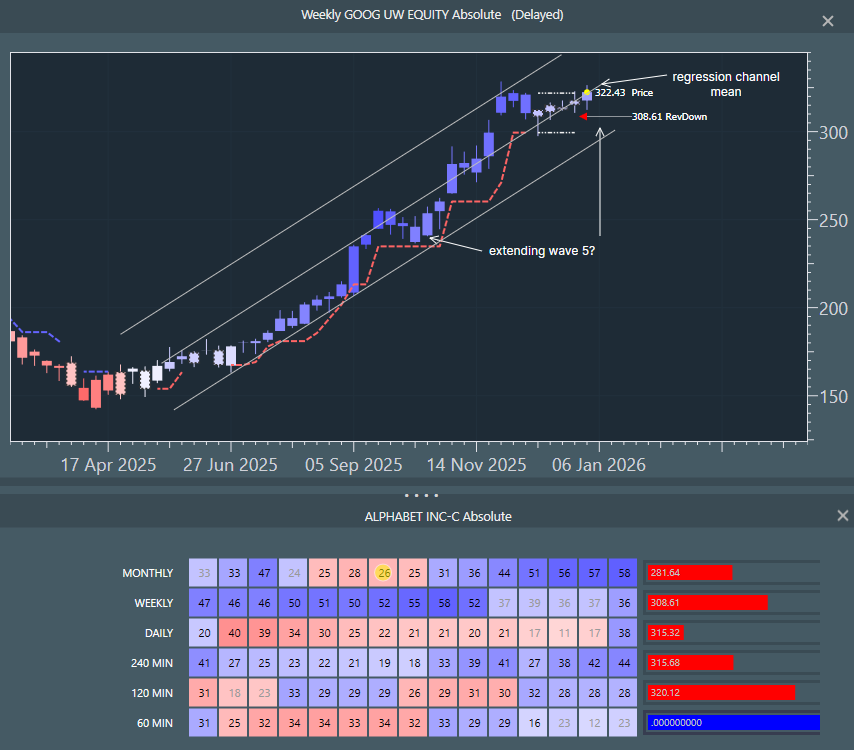
Price has been in a quasi-consolidation for the past four weeks, but is challenging the upside breakout level, which points to a longer uptrend continuation if it pops free. In the multi-timeframe window, we see blues incrementally building power for seven months. There has been a mild deceleration (i.e. early rally 31 to 36 to 44 to 51 to 56 and latter stage 56 to 57 to 58), but there is not enough evidence yet to point to exhaustion. We assume that the longer uptrend is intact and that we are re-joining. Note that the weekly row has broken to non grey blue and daily has just broken to blue. In the chart, price is also challenging the regression mean from April 2025.
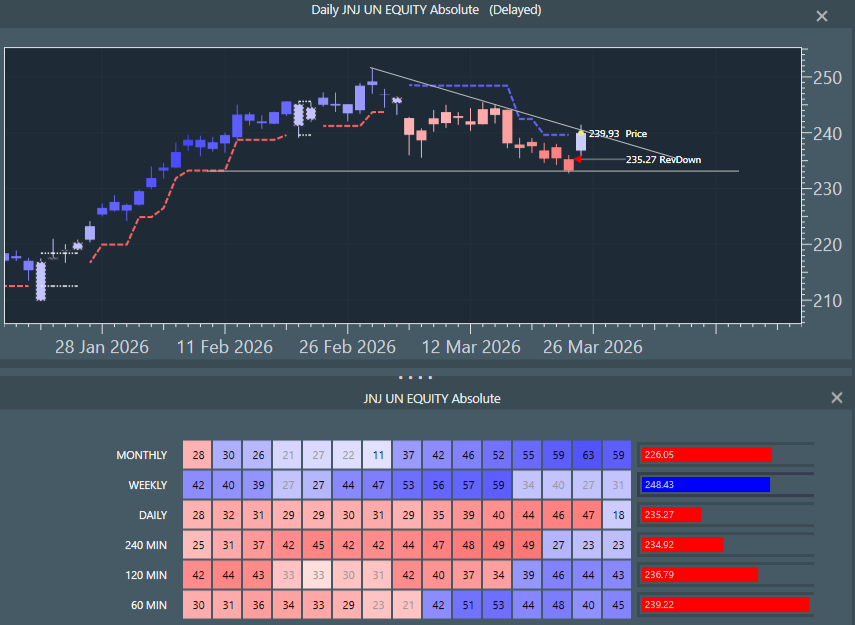
Cisco Systems (CSCO) - incipient breakdown.
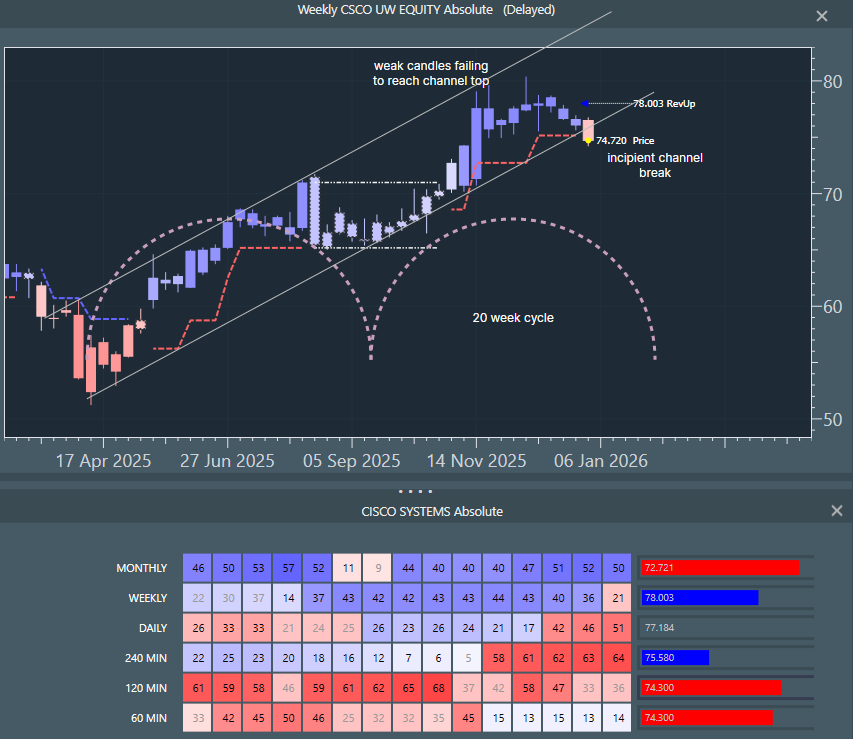
Price is challenging the bottom of the April 2025 channel and the preferred view is that it breaks. The next 20 week cycle trough looks to be early February, so we are assuming a decline into this time-zone. The multi-time window has shown a drop in blue power at the monthly level and note the red bar to the right of the heatmap row. This is full red and has the breakdown to red at 72.7 - the system anticipates breakdowns. Weekly has just turned red and daily and 240 minute have accelerated down. Note the long upper wicks in the chart as they probed and failed to reach the channel top, this shows buyers unable to control the highs, so in that sense, we had a lead indicator on current weakness back in November.