US Large Caps in Focus - BMY+, GOOG-, TSLA- (5 February 2026)
Notes: we tend to focus on inflections on the weekly data level to strip out noise and, hopefully, call trades of more meaningful longevity. The basic system is a dynamic heatmap and colours: Up as Blue and Down as Red. Momentum is woven into the price series, such that paler colours represent lessening of power and stronger colours, increasing power. The sub-window shows the heatmap with momentum numbers at each timeframe from hourly to monthly.
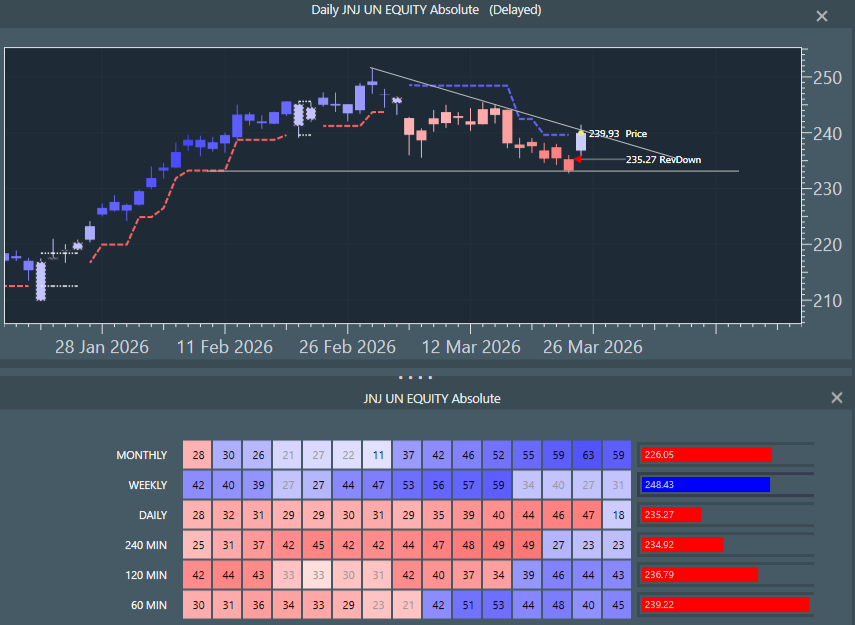
Note: position changes Exiting Long JNJ US at market close 5 February. Position entered 13 January at 209.9 (see note of that date). Starting to get into overbought territory.
Bristol Myers Squibb Co (BMY) - break out to up continuation.
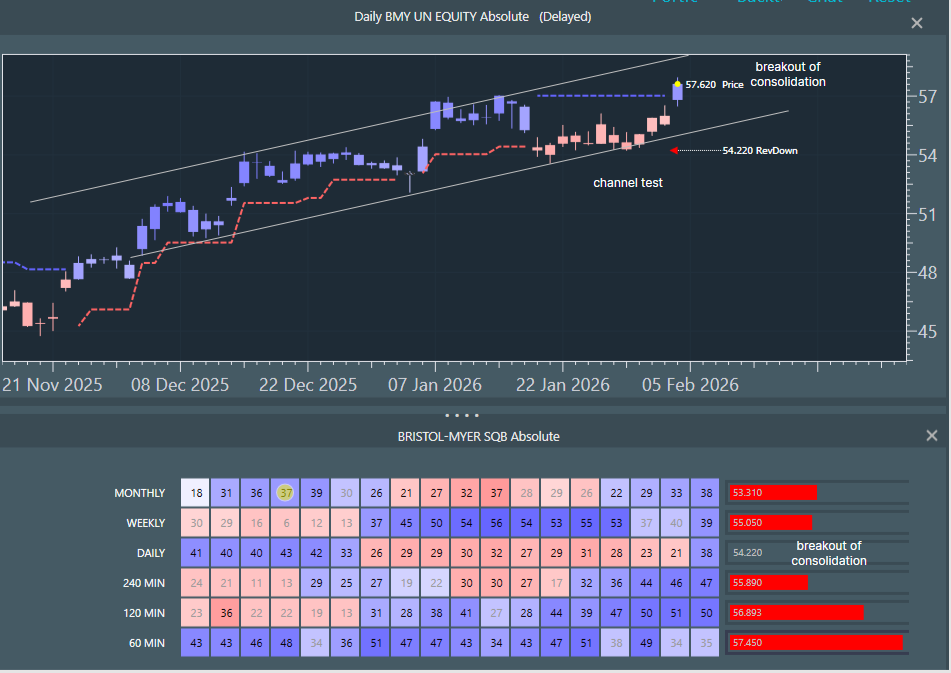
Daily chart consolidation breakout after channel test. Higher timeframes blue momentum increasing. Longer uptrend intact for a re-join.
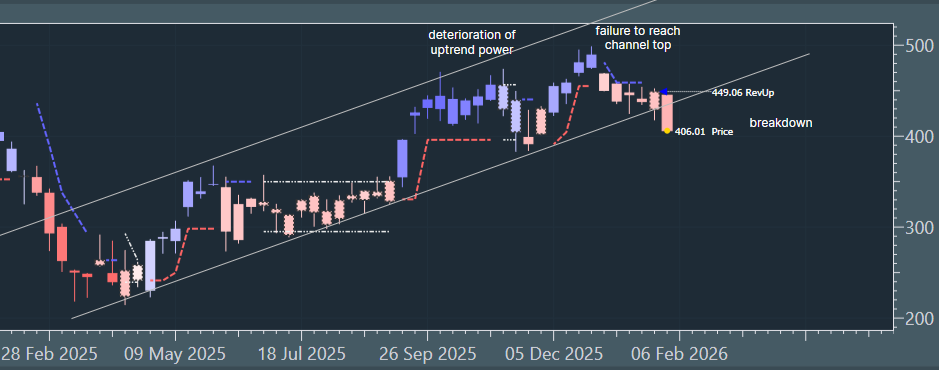
Alphabet Inc. (GOOG) - trend breakdown threatened.
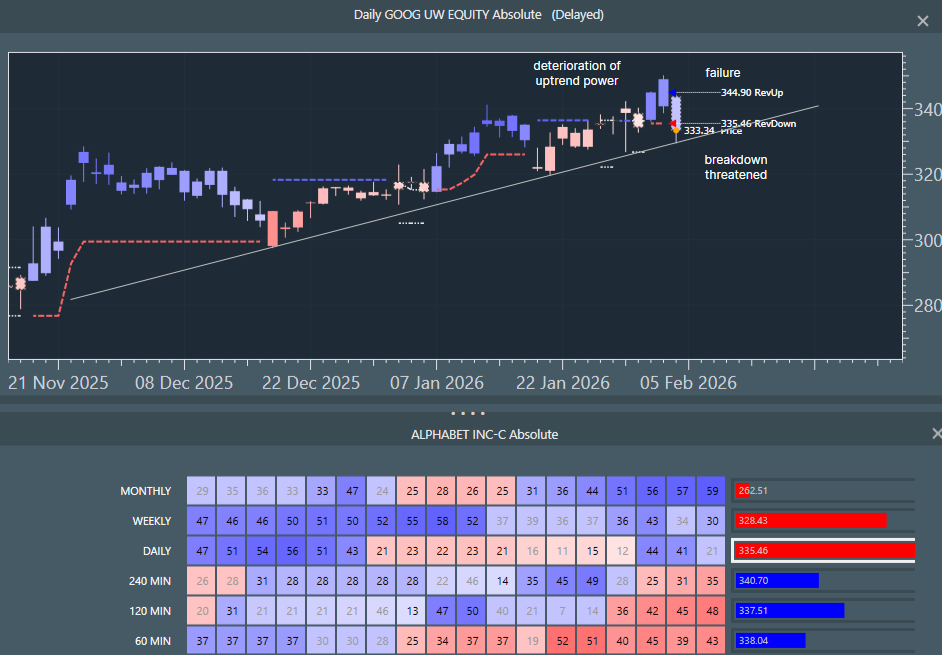
The daily chart has been rising in a shallow trajectory on weakening uptrend power. Blues deteriorating and too many rest phases to be healthy. Price jolted lower and is testing a breakdown on the uptrend support line. Intradays are red down. Weekly blue power has been bleeding out for eight weeks.
Tesla Inc (TSLA) - downtrend continuation
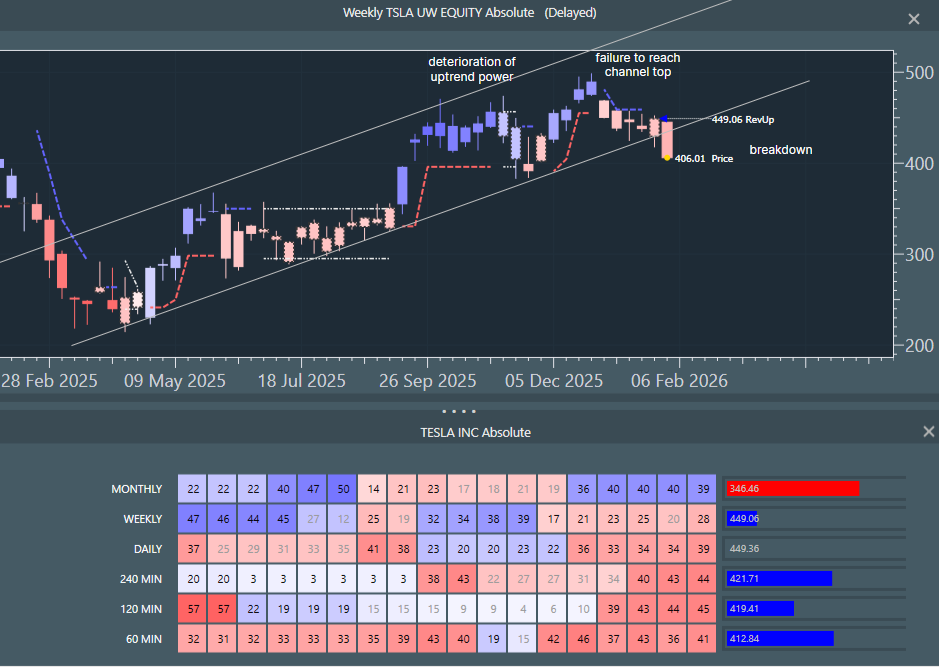
Weekly chart shows trend channel breakdown after significant uptrend deterioration. All timeframes from weekly lower are red down on increasing momentum numbers.