US Large Caps in Focus - BRK/B(-), SBUX(-), JNJ(+) - 26 March 2026
Notes: The basic system is a dynamic heatmap and colours: Up as Blue and Down as Red. Momentum is woven into the price series, such that paler colours represent lessening of power and stronger colours, increasing power. The sub-window shows the heatmap with momentum numbers at each timeframe from hourly to monthly.
BRK/B (Berkshire Hathaway) - Down break/continue (-).
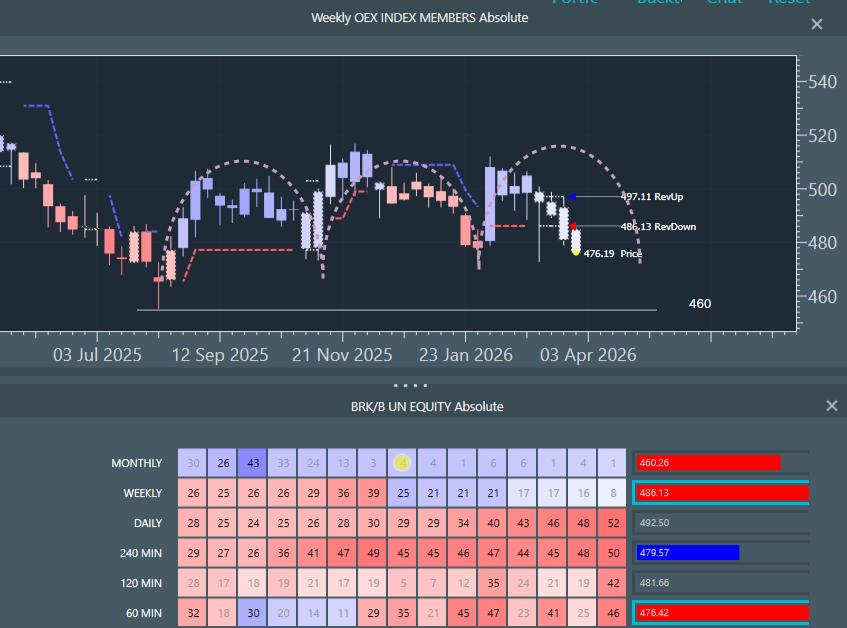
Looking for a downtrend continuation weekly chart.
*Monthly - blues super pale/stall - low power. Downside risk edge 460.
*Weekly - blues super pale/stall - low power. Downside risk edge challenged and breaking to red down.
*Daily and lower - strong red down and accelerating.
*Intermediate cycle still downswing phase.
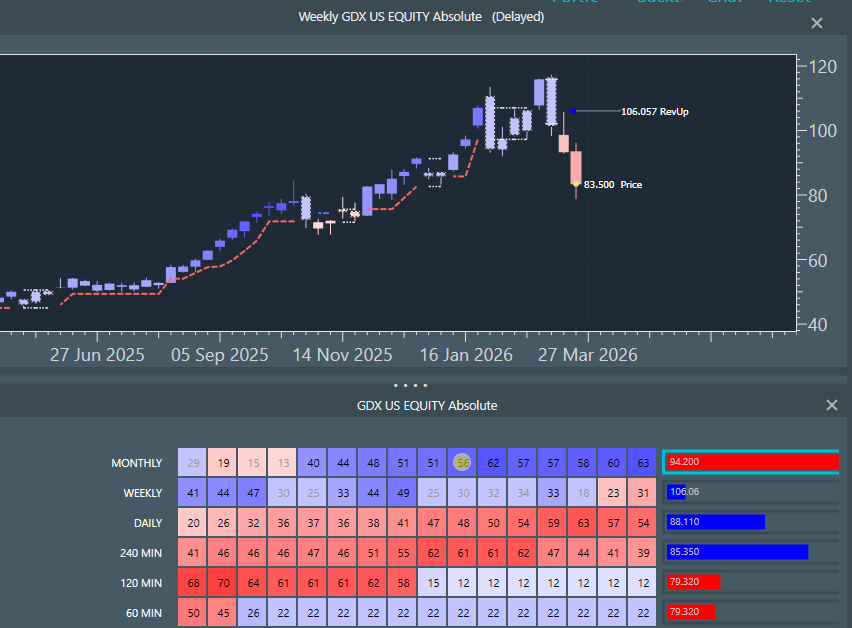
SBUX (Starbucks) - Down reversal (-).
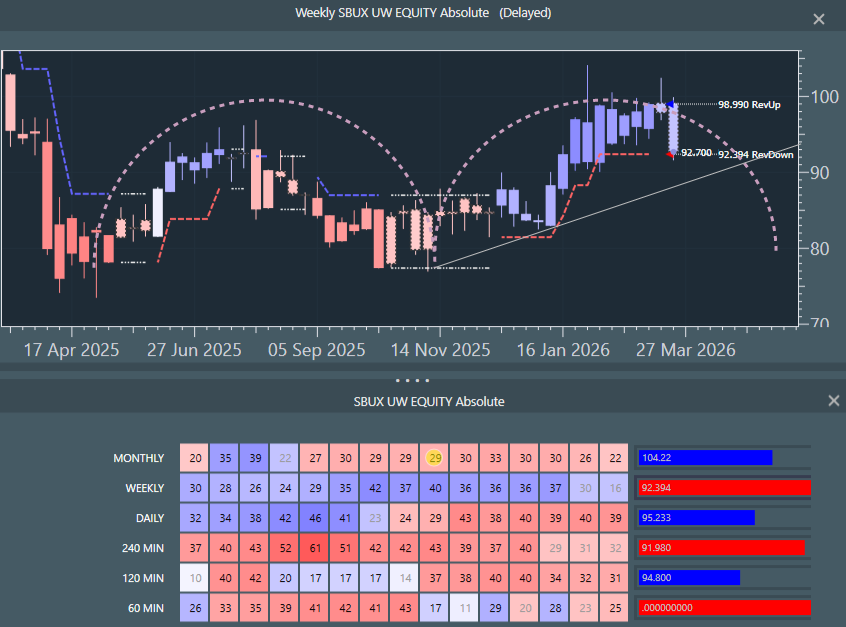
Seeing intermediate cycle as having topped out, weekly chart.
*Monthly - pale red weak down.
*Weekly - grey blue uptrend stall out and testing red downside risk edge.
*Daily and lower- mixed reds as weekly challenges breakdown level
*Intermediate cycle downswing phase.
JNJ (Johnson & Johnson) - Uptrend re-join (+)
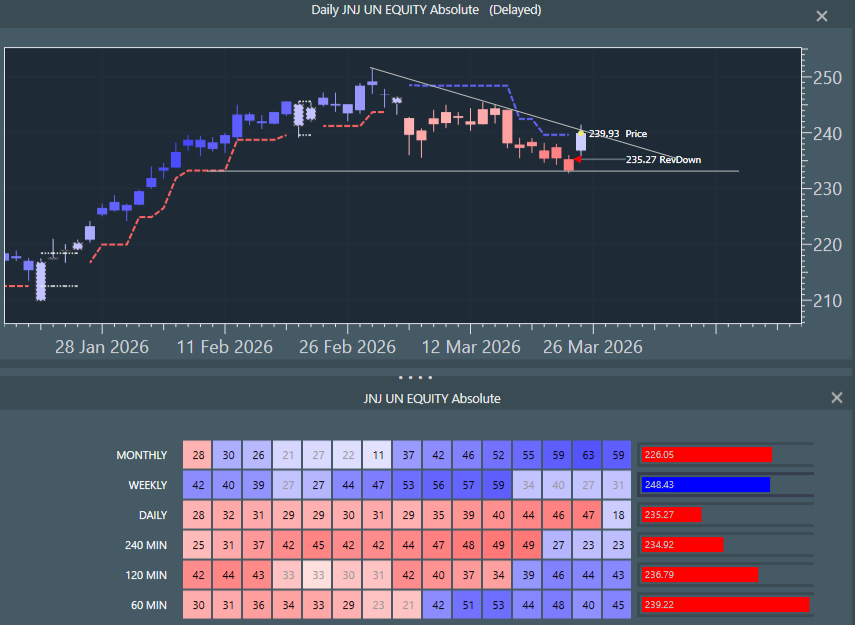
Longer term uptrend intact, tactical re-join being attempted, daily.
*Monthly - strong blues, long uptrend intact.
*Weekly - grey blue uptrend consolidation out of strong blues - re-join preferred.
*Daily and lower- building blue power.
*Shallow, choppy decline out of prior strong rally. Price hit a balance point and is now challenging downtrend return line.