US Large Caps in Focus - GM- (10 February 2026)
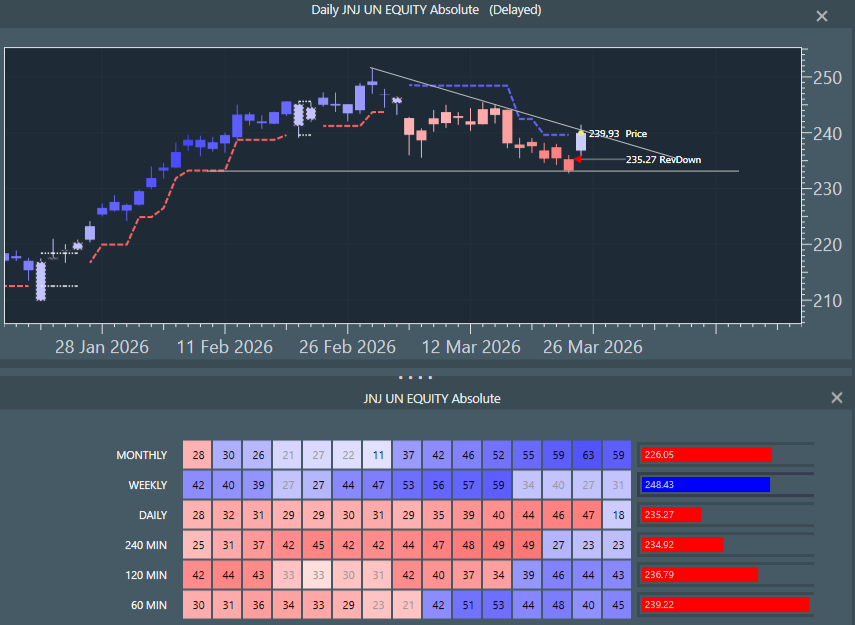
Notes: we tend to focus on inflections on the weekly data level to strip out noise and, hopefully, call trades of more meaningful longevity. The basic system is a dynamic heatmap and colours: Up as Blue and Down as Red. Momentum is woven into the price series, such that paler colours represent lessening of power and stronger colours, increasing power. The sub-window shows the heatmap with momentum numbers at each timeframe from hourly to monthly.
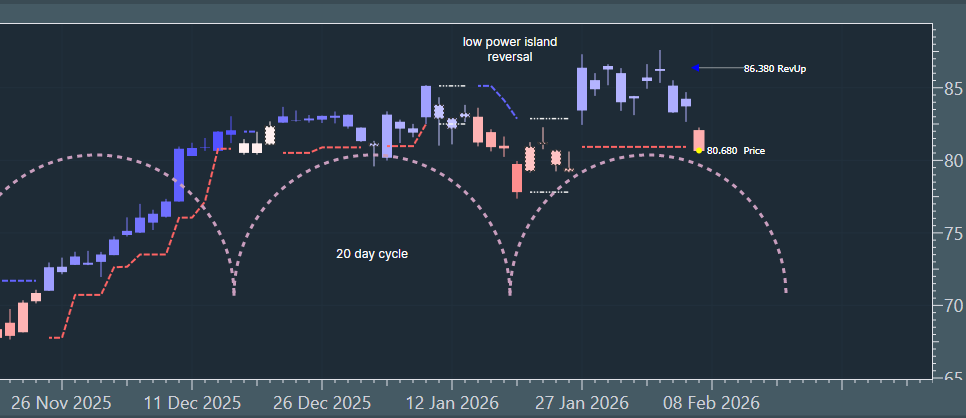
General Motors Co (GM) - break down.
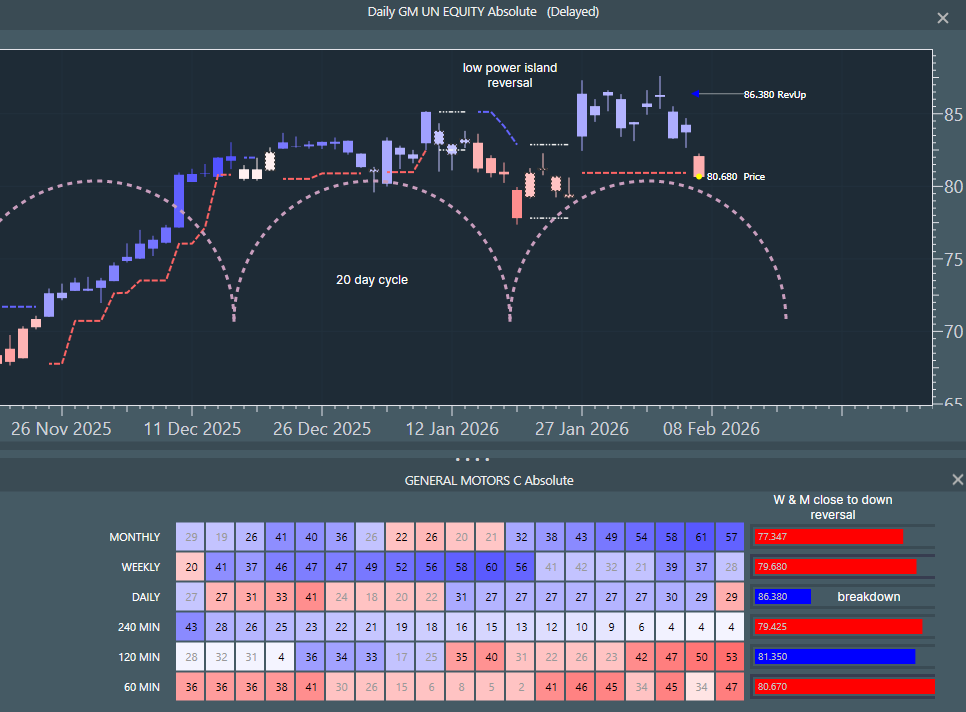
Daily chart shows a final jolt higher on 27 January and a nine session low blue set (i.e. upside power loss, despite higher prices). Some would call this an island reversal set up: gap up, sideways range, gap down and breakdown). Daily has turned red, weekly has completely lost blue power and is close to the down reversal level at 79.68. There is a 20 day cycle shown and the next trough is not until mid month. It could well be a larger cycle that has turned too.