US Large Caps in Focus - Index level, Dow Jones and Sectors - (17 March 2026)
Notes: The basic system is a dynamic heatmap and colours: Up as Blue and Down as Red. Momentum is woven into the price series, such that paler colours represent lessening of power and stronger colours, increasing power. The sub-window shows the heatmap with momentum numbers at each timeframe from hourly to monthly.
US Equity Index Futures (ES, NQ, HWI, RTY) - intraday thrust and Nasdaq (NQ) leading.
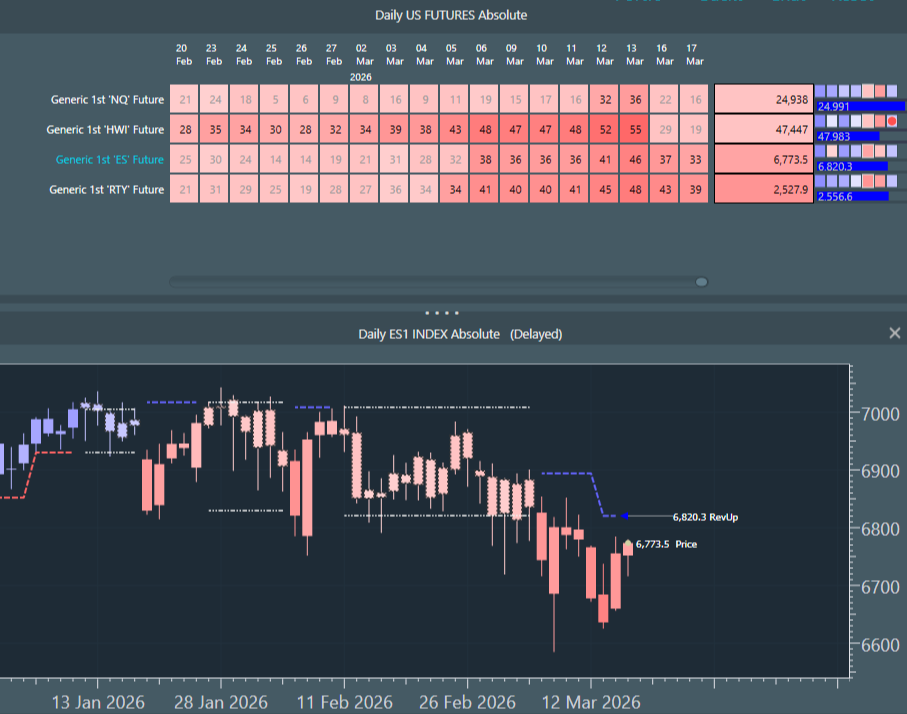
All US Index futures are still red down basis daily data, although we are starting to see lightening reds and lower power numbers indicating a near term unwind of down power. To the right of the heatmap we can see that the risk progress bars are blue and filling up, with NQ (Nasdaq contract) nearly full blue with the risk level at 24,991. These bars show how close price is to its daily upside colour change level (blue in this case).
Notice also the mini matrix of coloured cells - left hand side show blue power building on intraday timeframes: 60, 120, 240 and 480 minute. Again, NQ is in the best shape in terms of lower timeframe thrust. Because the markets are still very geo-political news driven, its just too soon to say whether this burst of activity is a legitimate kick off move or just another bear market rally waiting to be squashed back down.
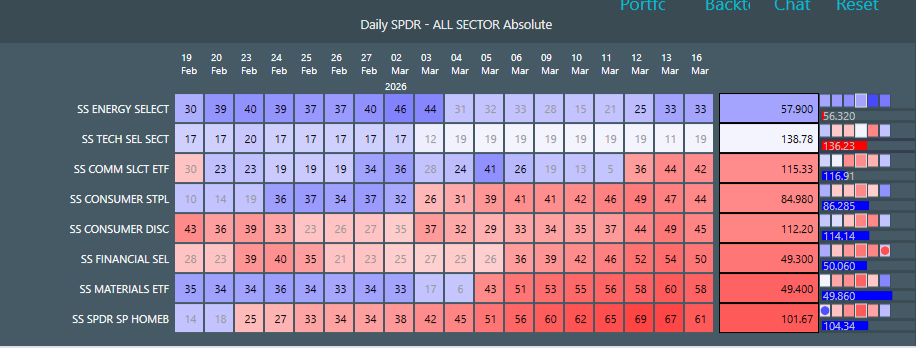
SPDR broad sectors - daily

One measure of market breadth at a higher level is the state of blueness of redness (up or down trend direction) across the SPDR Sectors. Here we see mostly strong red down and no meaningful intraday blue power in the mini-matrices. In other words, the sectors are not setting up for a rally phase right now. Energy (XLE) is still at the top, but notice that after the grey blue rest phase (4 to 11 March) price has picked up to full blue uptrend again, but on lesser power that the rally phase that ended 3 March (momentum of 33 versus 44). This is an incipient bearish momentum divergence. But again, its largely news-flow driven at this stage
Dow Jones selection - mostly red down, bearish breadth.
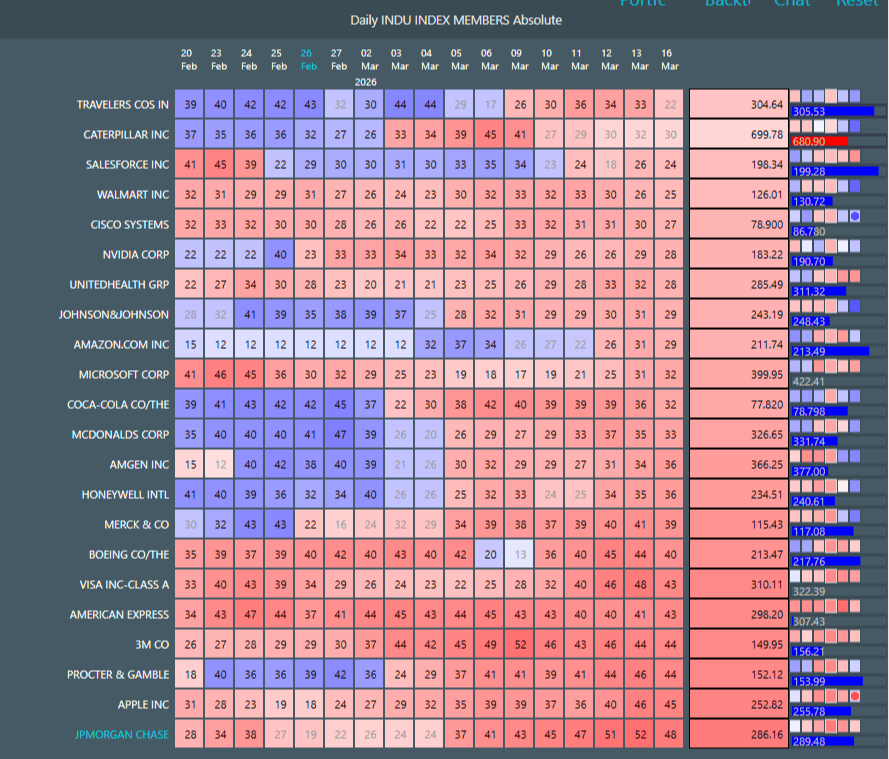
Only three names in the Dow's list of 30 tickers are blue (not shown) - Chevron, Verizon and IBM. Everything else is red. So as far as the actual cash market is concerned, it has not been responding well to macro impulses affecting Index futures. Risk is still to the downside for now.