US Large Caps in Focus - LLY-, MA-, TGT+ (15 January 2026)
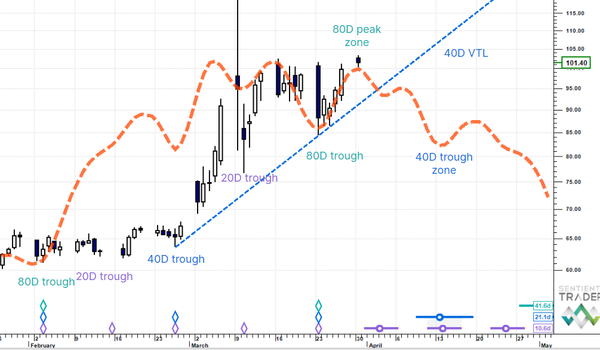
Notes: we tend to focus on inflections on the weekly data level to strip out noise and, hopefully, call trades of more meaningful longevity. The basic system is a dynamic heatmap and colours: Up as Blue and Down as Red. Momentum is woven into the price series, such that paler colours represent lessening of power and stronger colours, increasing power. The sub-window shows the heatmap with momentum numbers at each timeframe from hourly to monthly.
Eli Lilly & Co. (LLY) - rolling over.
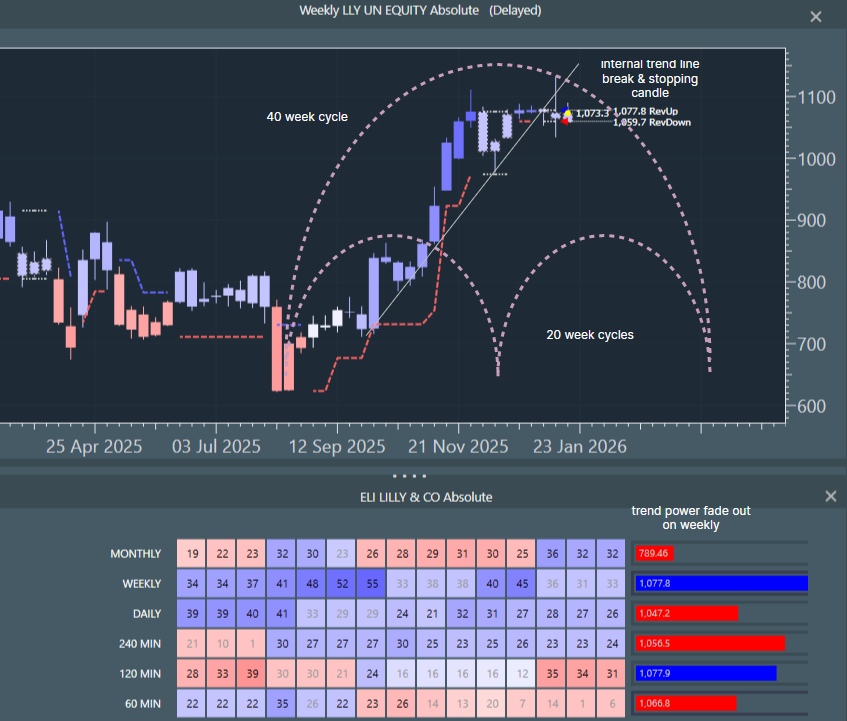
We believe that the spike low on 12 December was a 20 week cycle trough. This is a long cycle, but the upside follow through over the last five weeks has been uncharacteristically weak. Last week's candle could probably be called a shooting star - a very high upper wick showing that buyer urgency could not control the high and, so far this week, we see slack price action. Again, this does not look like early stage new long up-cycle behaviour. Note also, that the shooting star intersected a long uptrend support line, which we are now below.
Looking across to weekly blue power in the sub-window, notice that nine weeks ago we powered into blue 55, which is healthy up-momentum; then a three week grey blue rest phase. We would expect a decent upside resolution next, but we only reached blue 45 after two weekly sessions and then another rest - the grey blue phase we are in now. Why two rests in short succession? Because it is tired. The preferred view is for a graceful rollover.
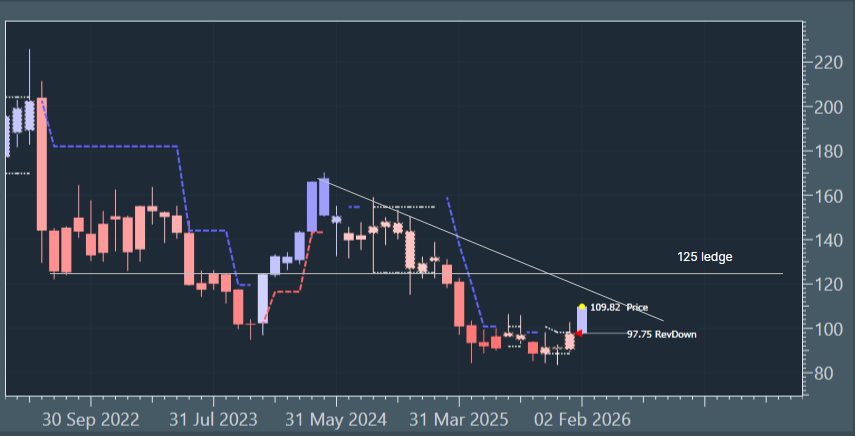
Mastercard Inc-A (MA) - long trend breakdown?
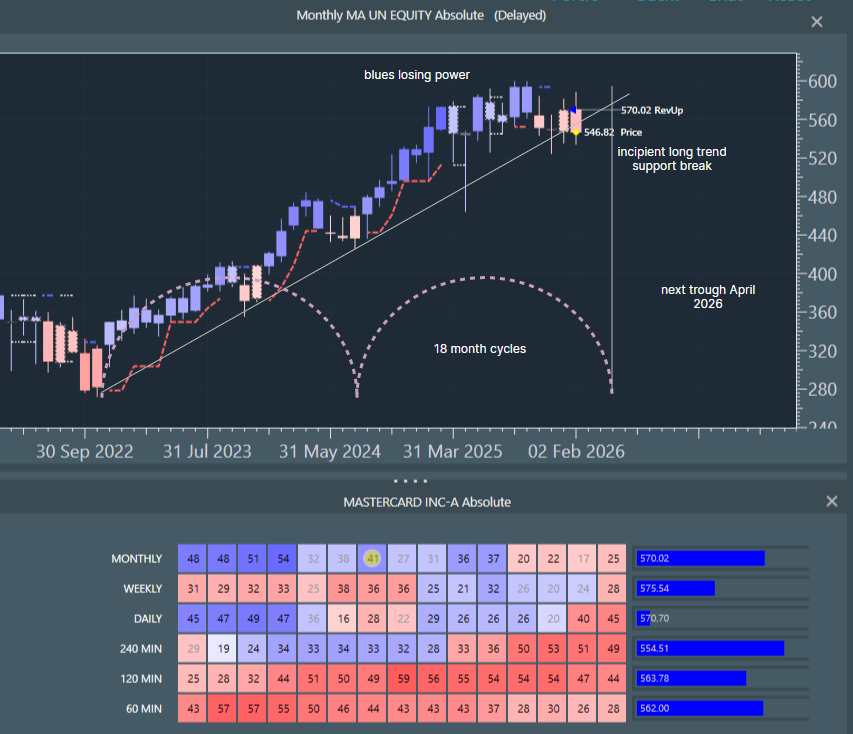
For this one we are focusing on the monthly profile. The low mid chart (July 2024) was an 18 month cycle trough and the next trough is due in April this year. The argument here is that's where price will fall into this date under its own weight. Price is currently testing trend support that has been in place since September 2022. If this conclusively breaks down, which is the preferred view, then the long trend has rotated, consistent with the 18 month cycle having peaked. Monthly blues have steadily been losing power since February 2025 as upside momentum has bled out. Notice in the sub-window, that weekly has just broken to red and that all timeframes are now red.
Target Corp. (TGT) - long term trend change?
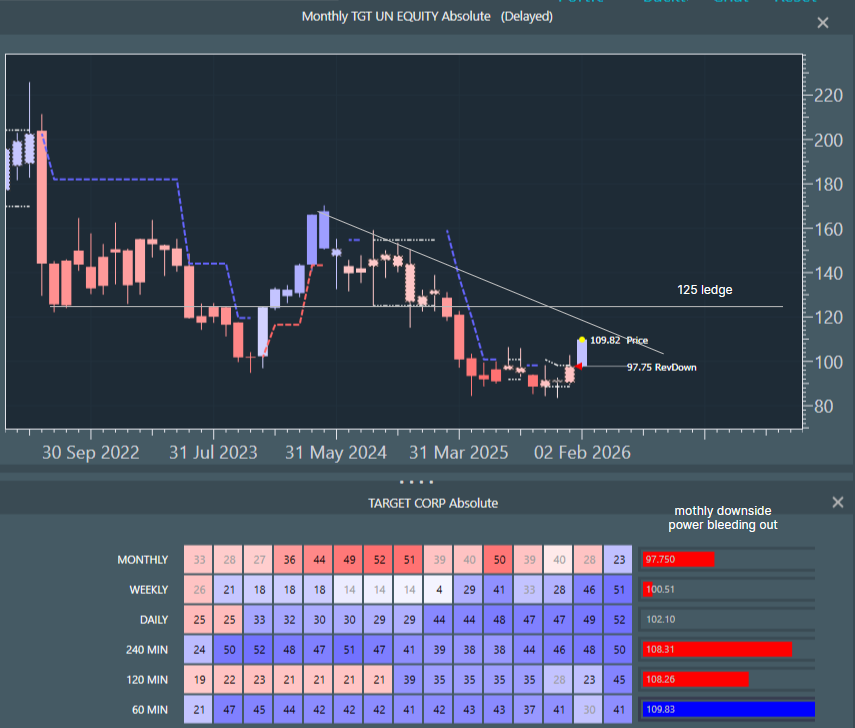
Again focusing on the monthly level, we have just had a break to blue, the first blue since June 2024. There is a key support/resistance ledge around 125 and with all timeframes below monthly blue and thrusting, we think this is a reasonable target and liquidity magnet.