US Large Caps in Focus - MMM+, INTU-, JNJ+ (13 January 2026)
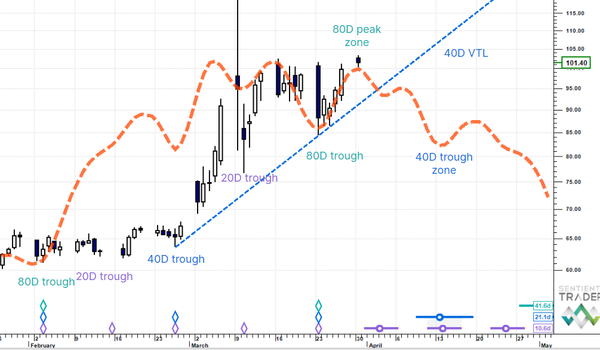
Notes: we tend to focus on inflections on the weekly data level to strip out noise and, hopefully, call trades of more meaningful longevity. The basic system is a dynamic heatmap and colours: Up as Blue and Down as Red. Momentum is woven into the price series, such that paler colours represent lessening of power and stronger colours, increasing power. The sub-window shows the heatmap with momentum numbers at each timeframe from hourly to monthly.
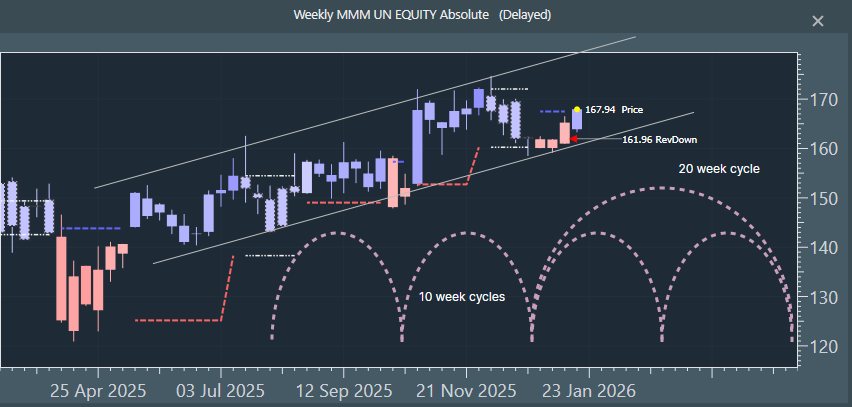
3M Co. (MMM) - uptrend re-join.
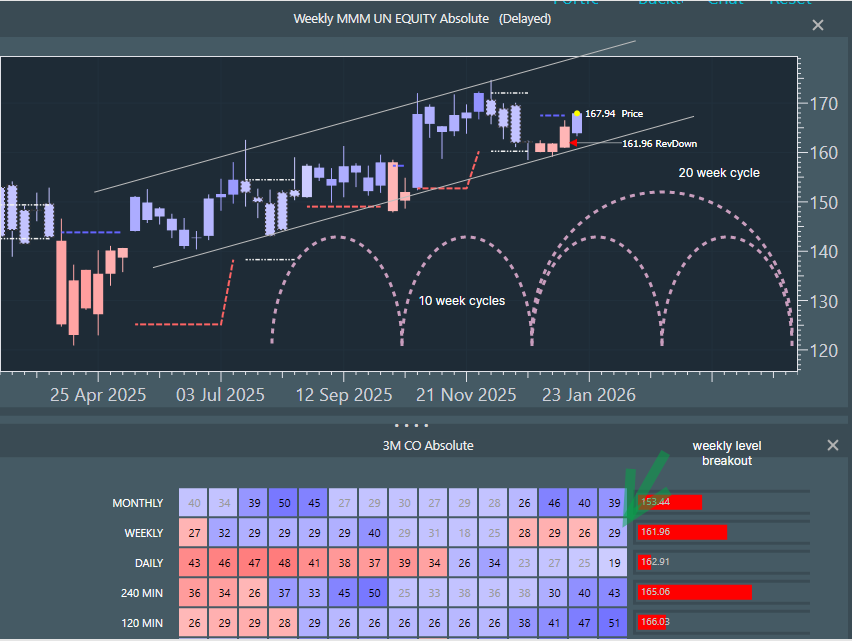
MMM has just turned blue in the weekly heatmap row, which makes for blue on all timeframes now, i.e all are convergent. Price found support at the June 2025 channel and we believe that a new 20 week cycle started up around Christmas time. This longer cycle is, therefore, young and rising and its component 10 week cycle is not due to bottom until mid-March. Because the underlying uptrend looks to be intact, we can assume that the next 10 week peak comes in late in the cycle (right translated), which gives us time to expand. We are viewing this as a congestion breakout and uptrend re-join.
Intuit Inc. (INTU) - twenty week cycle still falling.
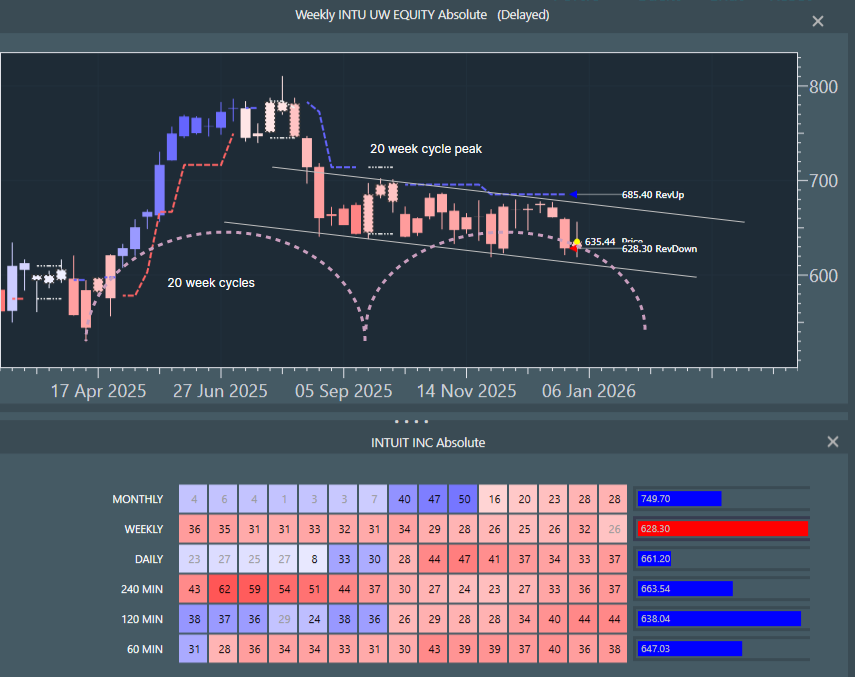
INTU is red on all timeframes, with momentum numbers building all the way down below the weekly level, which points to downside thrust. Monthly red can be seen as pressure from above. It looks like we had a 20 week cycle trough in mid last September and, despite an initial flurry higher, the cycle then started collapsing in on itself. This means that an even longer cycle is leaning down on it. The next 20 week cycle trough is not due until the end of February. Price has being grinding lower in a channel for months now and the preferred view is that it falls out of the bottom. Yes, there may be a reaction at channel support, but there is too much weight on price for this to come to much.
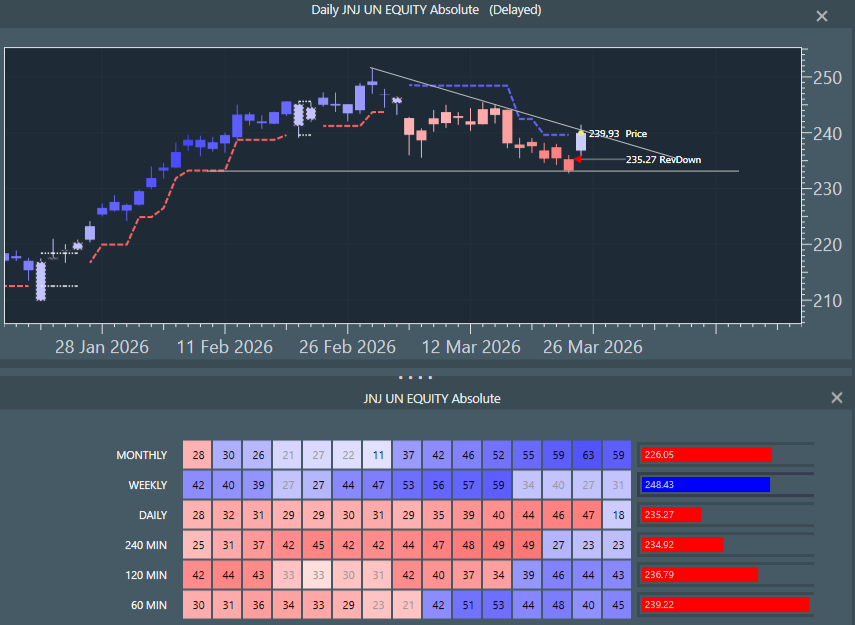
Johnson&Johnson (JNJ) - incipient breakout.
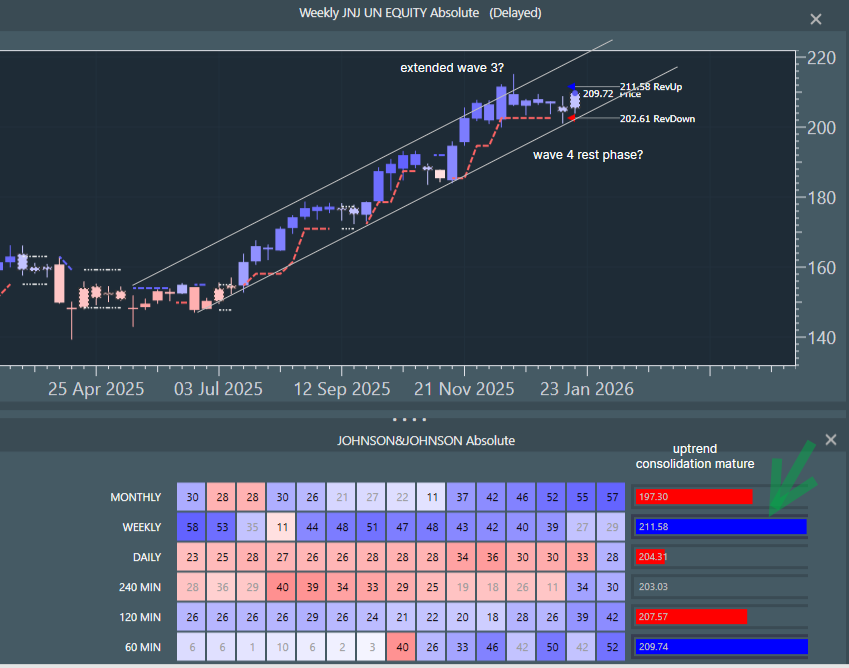
This seems to be relatively straightforward case of: test of channel support after consolidation and uptrend re-join starting. You will notice strong blue power on the monthly row, which has been building incrementally for six months now. This points to the longer uptrend, which we believe is being re-joined. We have a blue breakout at the daily level and although the weekly row shows grey blue consolidation cells, the full blue risk bar to the right says that this might now be mature.