US Large Caps in Focus - NVDA (-) 27 March 2026
Notes: The basic system is a dynamic heatmap and colours: Up as Blue and Down as Red. Momentum is woven into the price series, such that paler colours represent lessening of power and stronger colours, increasing power. The sub-window shows the heatmap with momentum numbers at each timeframe from hourly to monthly.
NVDA (NVIDIA) - Breakdown underway.
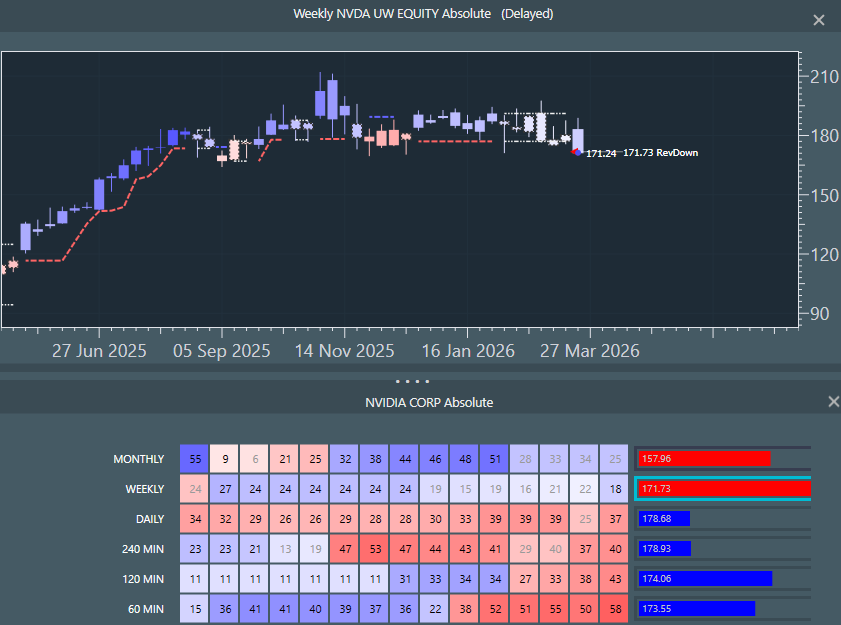
Looking for a downtrend break weekly chart.
*Monthly - ostensible consolidation, which is starting to threaten breakdown at this degree (at 158 from the filling red risk bar).
*Weekly - Long pale blue range went even paler from five days back to dead on its feet. Now weekly risk bar is full red with blue frame - i.e. its challenging breakdown level in real time, its effectively now a red cell and candle.
*Daily and lower - strong red down and accelerating.
*Intermediate cycle rolling over.