US Large Caps in Focus - US Index Futures snapshot (9 January 2026)
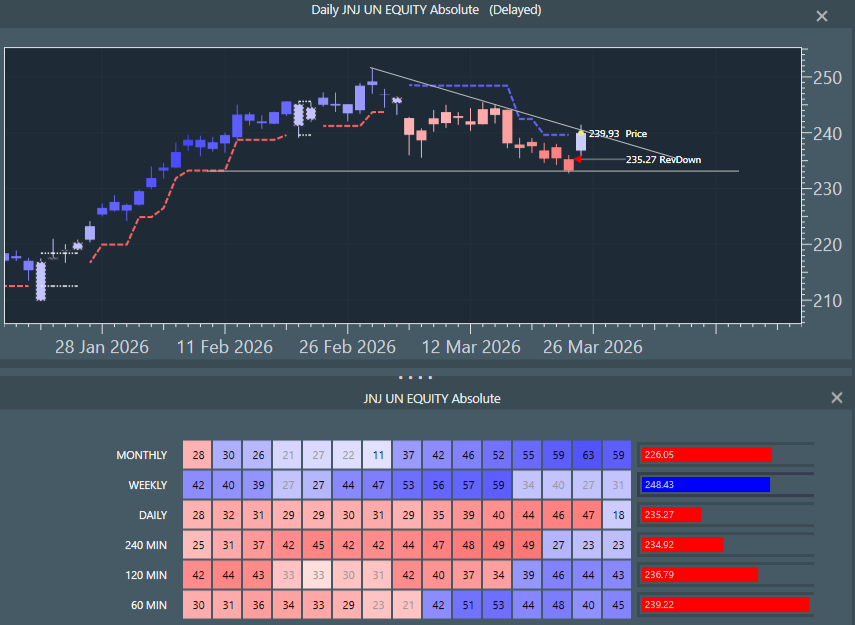
Notes: we tend to focus on inflections on the weekly data level to strip out noise and, hopefully, call trades of more meaningful longevity. The basic system is a dynamic heatmap and colours: Up as Blue and Down as Red. Momentum is woven into the price series, such that paler colours represent lessening of power and stronger colours, increasing power. The sub-window shows the heatmap with momentum numbers at each timeframe from hourly to monthly.
US Index Futures - pushing
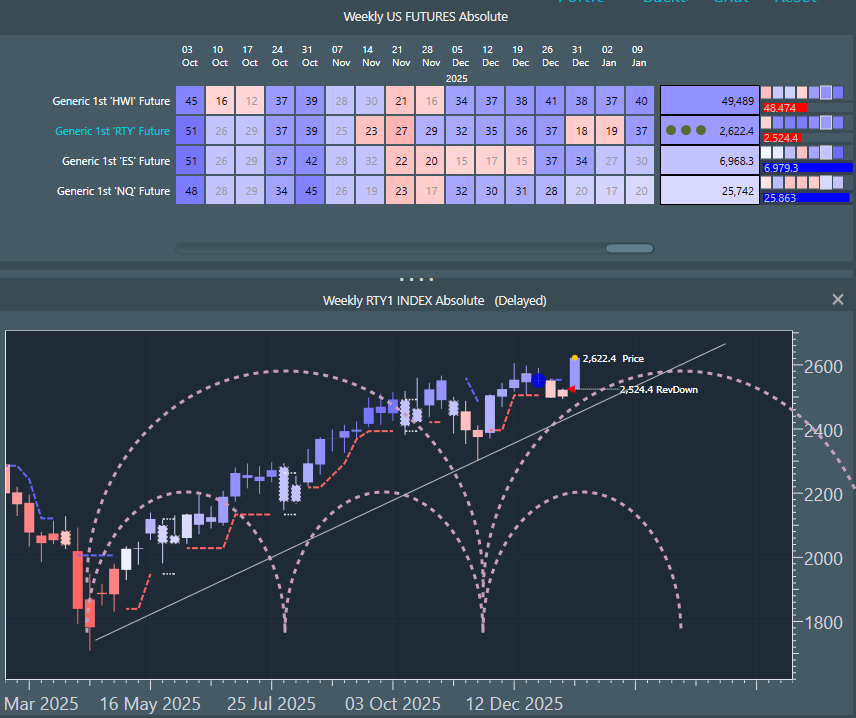
Russell 2000 has just turned blue basis weekly data with three conviction dots. Although this note series concentrates on large caps, it as well to understand the movement of smaller caps, animal spirits as it were.
The larger semicircle represents the nominal 40 week cycle and I think it is safe to assume that the 21 November low was the 40 week trough, which means that this new long cycle is young and rising.
We subdivide the cycle into its component 20 week cycles (the smaller semicircle) and this one is not due to bottom until mid-March. The last 40 week cycle peaked very late, which we call right translation, and implies an even longer term bullish influence. This in turn implies that we see higher highs and higher lows going forward and that the next 20 week cycle top comes in late, probably into early March.