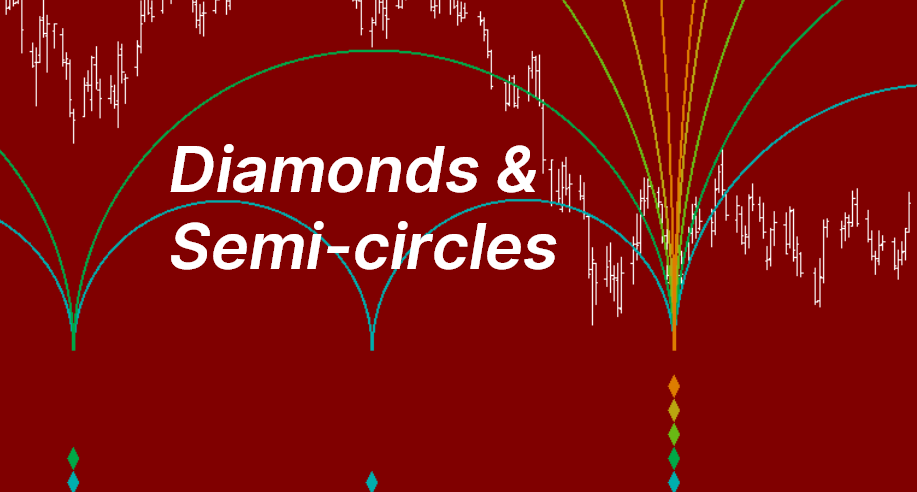
Diamonds and semi-circles
Marking cycle troughs with diamonds and describing cycle arcs using semi-circles.
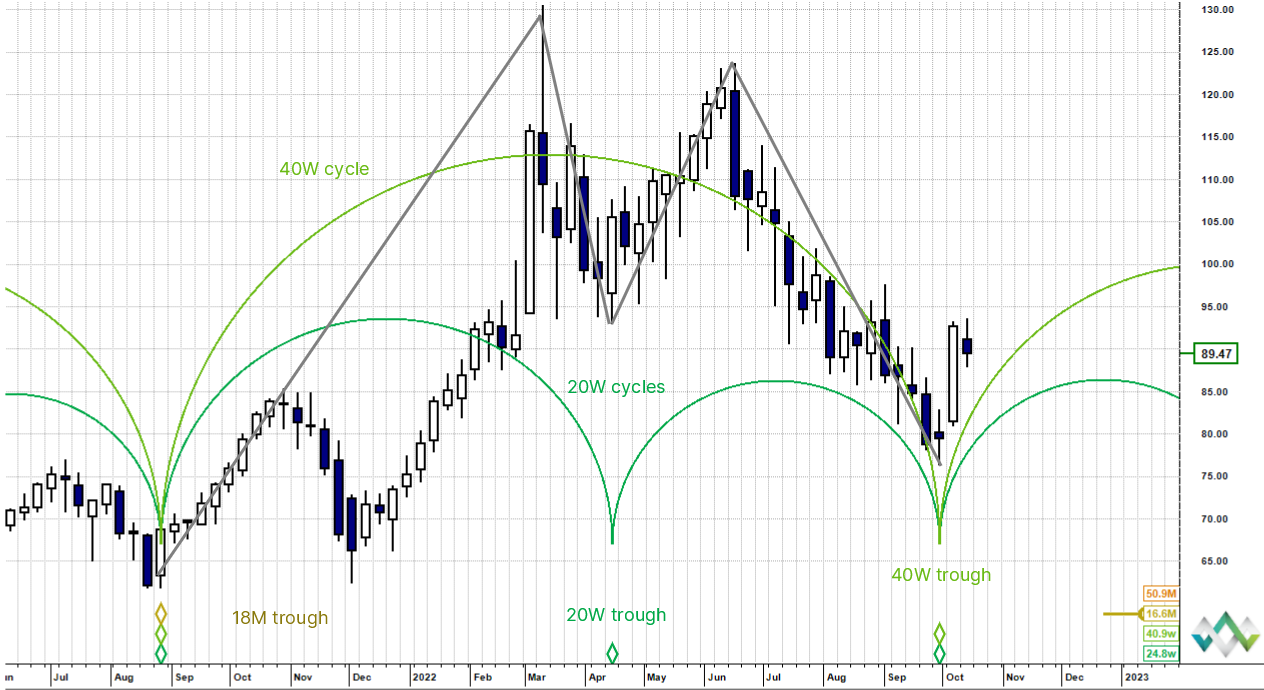
The chart shows the entire arc of a 40 week cycle and two rotations of the next lower cycle, the 20 week. "40 week" and "20 week" here refer to the trough to trough wavelength. It should be remembered however that these nominal wavelengths are representations of specific cycles present in all market data, but that the actual wavelengths are long term averages approximating to "20" and "40" weeks and can vary somewhat.
There is a harmonic ratio of 2:1 between all neighbouring cycles (note: except for the 54 month cycle which breaks down into three 18 month cycles, i.e. a 3:1 ratio). Each cycle in the nominal model is colour coded (link to glossary of terms)
Diamonds
The diamonds at the bottom of the chart mark the troughs of each cycle. Where we see a stack of diamonds, for example at the left edge of the chart it means that the longest cycle in that stack of diamonds has formed a trough, in this case the yellow diamond of the 18 month cycle. It follows in Hurst cycle theory that all of the harmonically related lower wavelength cycles must also troughed at the same time, thus the stack.
So from the start, namely the 18 month cycle trough on the left most edge, the next diamond is the 20 week cycle trough (April 2022)mid chart and the last stack of diamonds on the right edge of the chart (early October 2022) shows the 40 week cycle trough.
Semi-circles
The semi-circles describe the theoretical arc of each cycle.
Notice that the 40 week cycle peak should theoretically have occurred high at the mid-point of the representative semi-circle, but in fact is dragged down as the component first 20 week cycle forms a trough. This creates the classic M-shape we look for in cycles analysis, because ultimately the price trajectory we see on a chart is a composite of all cycles interacting with one another - more on which in due course.
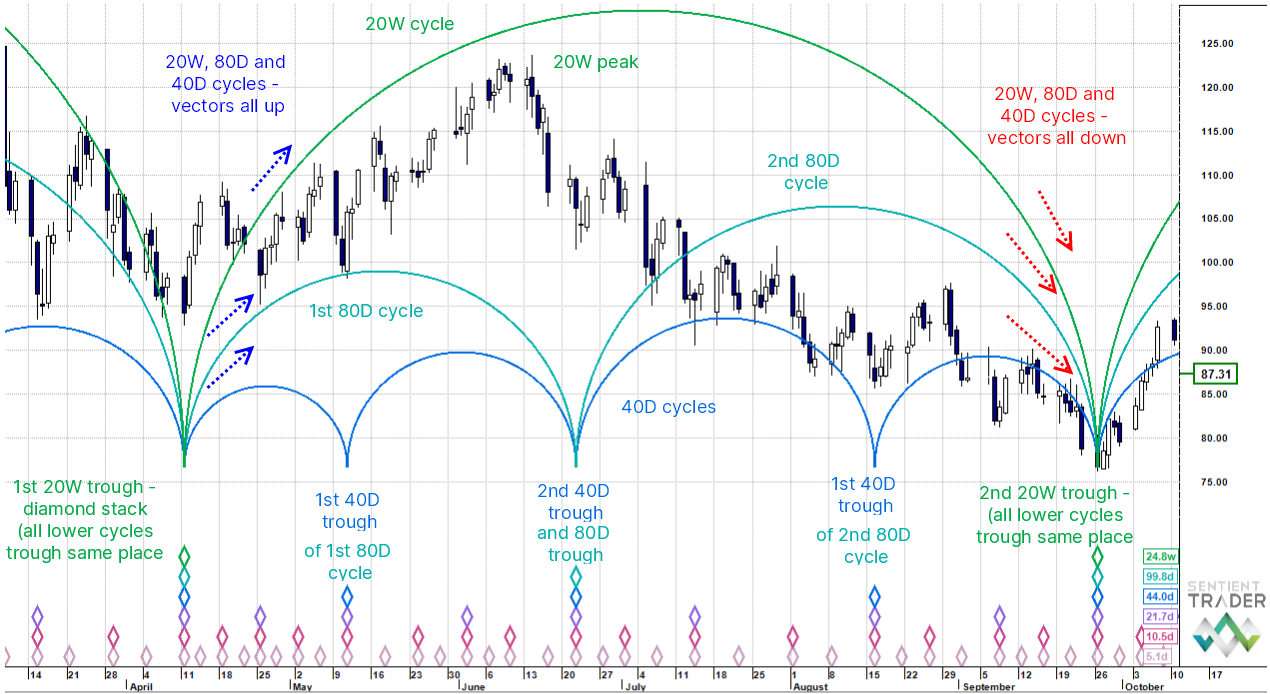
Let's now look a timeframe lower, where the same principles apply. The last full 20 week cycle has been carried over from the longer range chart and has been divided down into its component 80 day cycles and 40 day cycles.
The harmonic ratio of 2:1 should now start to make more sense: there are two 80 day cycles to one 20 week cycle and two 40 day cycles to one 80 day cycle. Each cycle belongs to a wider family and its phase (how far it is along its trajectory and whether up or down) and power (amplitude) all have a bearing on the composite cycle (i.e. what we perceive as price movement when looking at a chart).
It is the task of a Hurst cycles analyst to deconstruct the individual cycles, position their troughs and ascertain what is happening beneath the surface to gain an understanding of the whole picture and estimate where price might be heading.
Summary:
- diamonds mark cycle troughs,
- hollow diamonds are more tentative, solid diamonds are confirmed troughs,
- semi-circles describe the arcs of each cycle,
- cycles are harmonically related (generally 2:1),
- higher stacks of diamonds show higher magnitude cycle troughs.
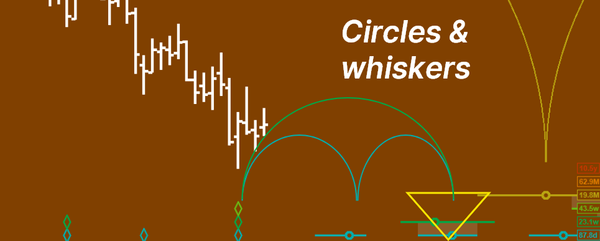
Next up ... Circles And Whiskers: