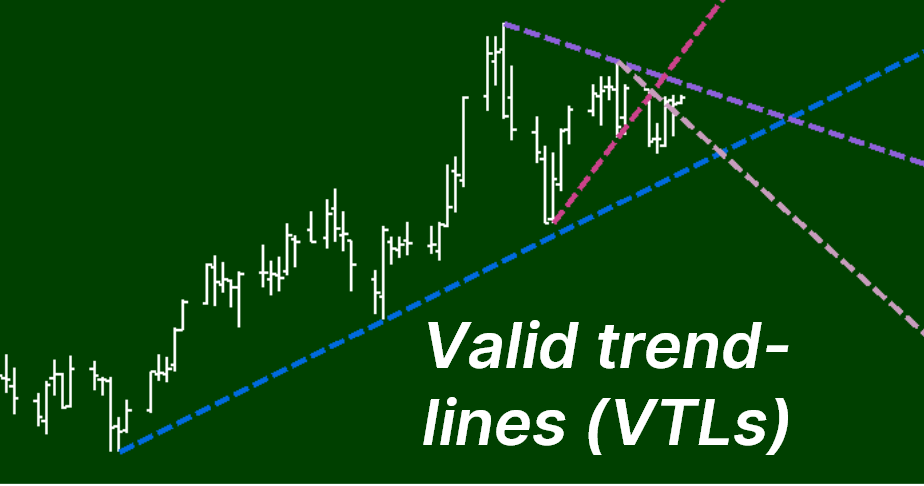
VTLs
Using trendlines specific to each cycle to identify the time and magnitude of past peaks and troughs..
Valid trendlines (VTLs) are unique to Hurst cycle analysis. They pertain to specific cycles and tell us where and when the next longer cycle in the nominal model has formed either a peak or a trough in past time. By extension, they can also be used to estimate future peak and trough locations.
For an up-sloping VTL we simply plot a straight line joining two adjacent troughs of a particular cycle and project it forward in time. For a down-sloping VTL it is a straight line joining two adjacent peaks of a particular cycle and again projected forward in time. (link to glossary of terms)
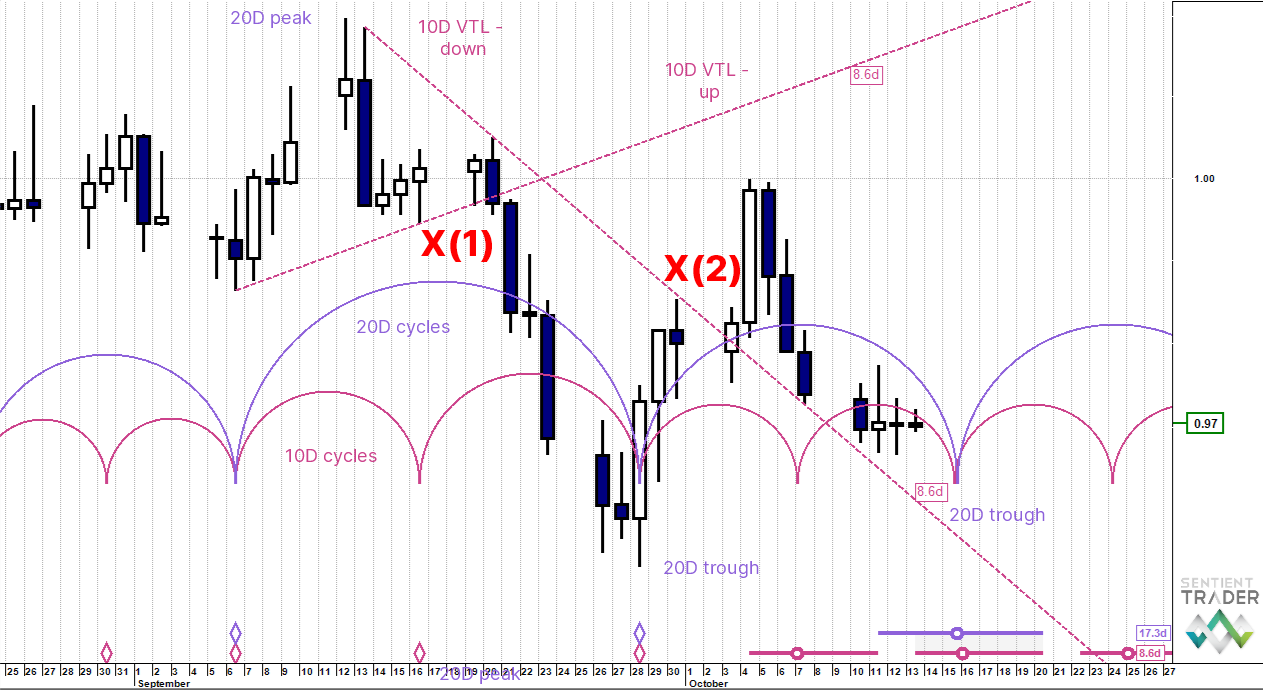
The up-sloping 10 day VTL was crossed down by price on 20 September X(1) and indicates that the last peak on 12 September was that of the 20 day cycle. If you look at this cycles representative semi-circle, you can see that the peak is strongly pulled to the left of the semi-circle. This is peak left translation and tells us the underlying trend is down - this will be covered in a later section.
The down-sloping 10 day VTL was crossed up by price on 3 October X(2) and indicates that the last trough on 28 September was that of a 20 day cycle. (note: the labels next to the VTLs (8.6d) refer to the average wavelength of the nominal 10 day cycle. This value is also shown in the bottom left corner of the chart in the 10 day cycle diamonds row).
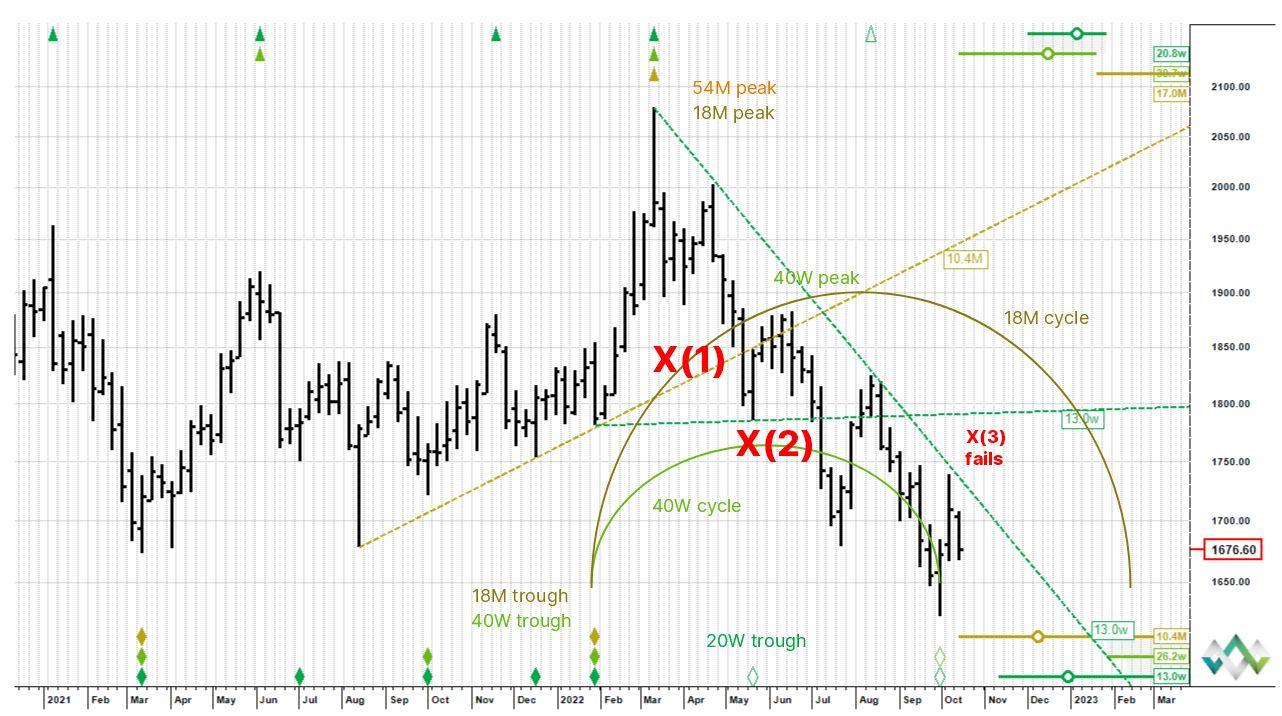
In this longer range Gold chart both 18 month cycle and 20 week cycle VTLs have been plotted. In the week of 16 May 2022 X(1) price crossed down through the 18 month VTL. This means that last peak was that of not only the 18 month cycle but also that of the 54 month cycle. One could argue that the signal is rather late, but VTLs are not the only way we place peaks and troughs and establish their magnitude - more on other methods later.. Also it is good information to have the size of that big peak, because it tells us a lot about underlying trend.
The gently up-sloping 20 week VTL was crossed down by price in the week of 11 July X(2). This tells us that 20 June peak was that of the 40 week cycle. Notice how strongly pulled to the left this peak is, another example of peak left translation and an indication that the underlying trend is strongly down at this point.
Finally, in the week of 10 October near the right edge of the chart, we can see that price rose up to the down-sloping 20 week VTL but failed to penetrate X(3). Thus we still cannot say for certain that the most recent price low is that of the 40 week cycle by just using VTLs.
Summary:
- VTLs are trend lines associated with specific cycles,
- If price crosses down through an up-sloping VTL, then we can say that the peak of the next longer cycle is in,
- If price crosses up through a down-sloping VTL, then we can say that the trough of the next longer cycle is in.