US Large Caps in Focus - Energy (-) and Gold Miners (+) - 25 March 2026
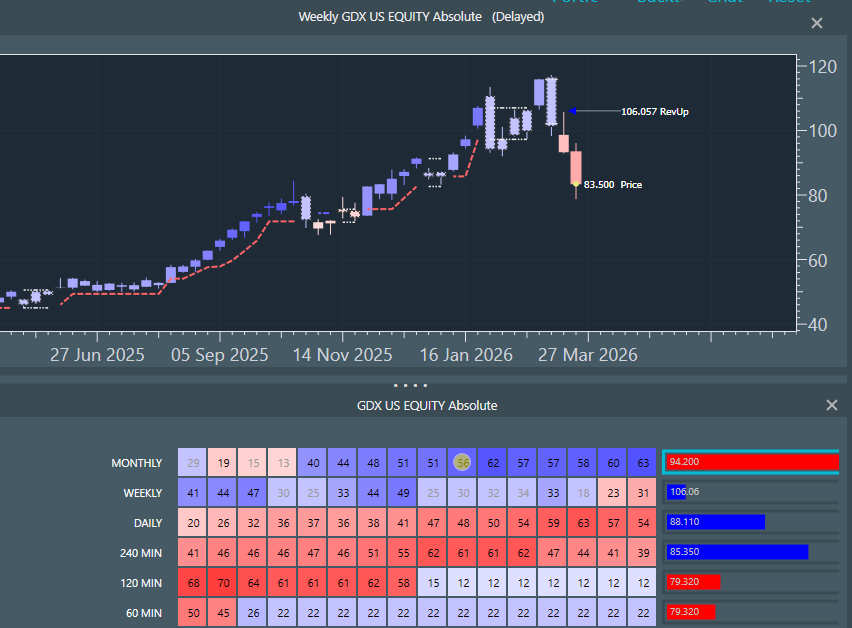
Notes: The basic system is a dynamic heatmap and colours: Up as Blue and Down as Red. Momentum is woven into the price series, such that paler colours represent lessening of power and stronger colours, increasing power. The sub-window shows the heatmap with momentum numbers at each timeframe from hourly to monthly.
Energy SPDR (XLE) - intermediate term over motivated, lowest timeframes momentum flattening.
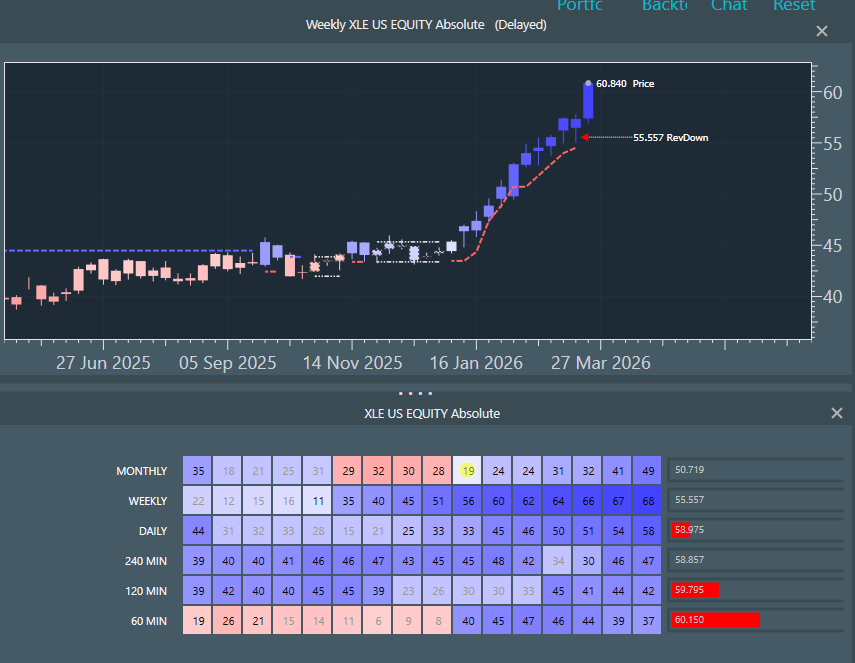
XLE is a crowded long and the weekly multi-timeframe momentum at Blue 68 has entered unsustainable territory. Although the daily timeframe has also pushed this week (blue power 51 to 58), we are starting to see momentum deterioration across the intraday timeframes. There may yet be a little more upside play, but the sector looks to be flying on fumes and is now or should be shortly a Sell.
Gold Miners ETF (GDX) - downside power slowdown and key level reached.

The weekly chart shows price back in the range of early January's consolidation just before it took off again. This is a not uncommon landing spot for the subsequent retracement. Daily red power has gone from overbought 63 to a milder 54 in three days, showing a potential unwind. 240 minute has unwound more significantly and the lowest timeframes have inflected to pale blues. It looks like a rotation higher is setting up.