US Large Caps in Focus - Index level - (3 March 2026)
Notes: we tend to focus on inflections on the weekly data level to strip out noise and, hopefully, call trades of more meaningful longevity. The basic system is a dynamic heatmap and colours: Up as Blue and Down as Red. Momentum is woven into the price series, such that paler colours represent lessening of power and stronger colours, increasing power. The sub-window shows the heatmap with momentum numbers at each timeframe from hourly to monthly.
US Equity Index Futures (ES, NQ, HWI, RTY) Breaking Down at intermediate degree.
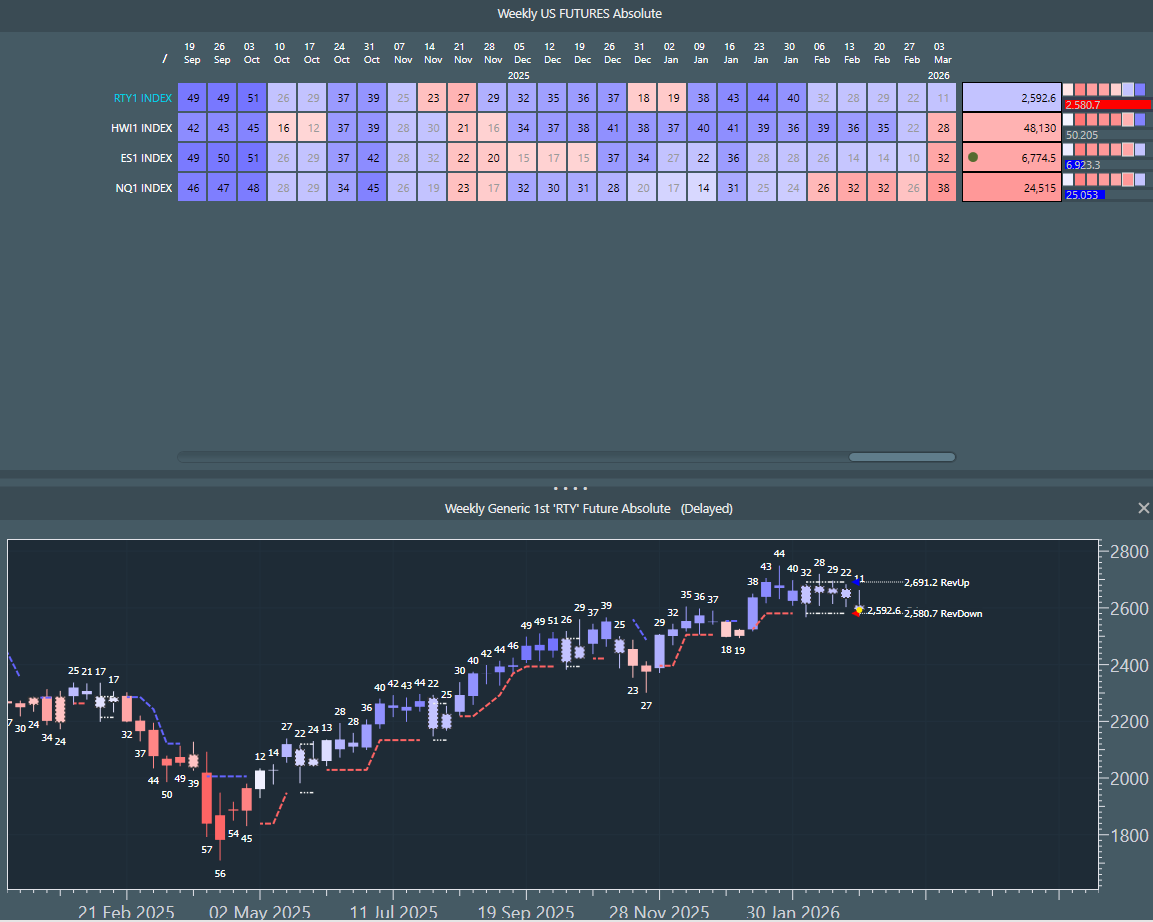
The heatmap basis weekly data shows NQ, ES and HWI all broken to red. RTY is at the bottom of its range and through 2,580 it is also red. Bearish intermediate term.
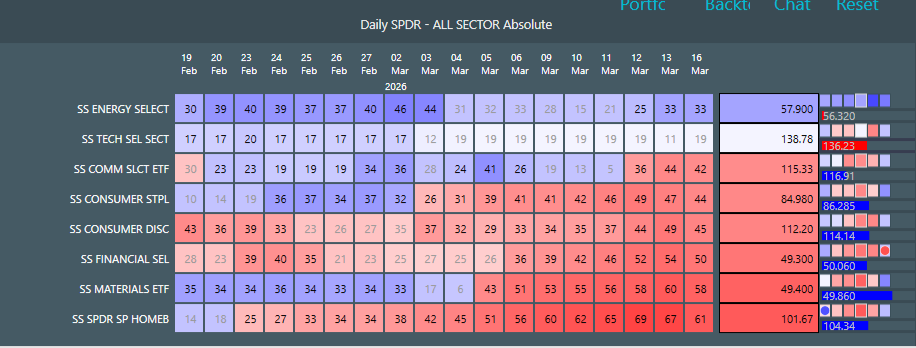
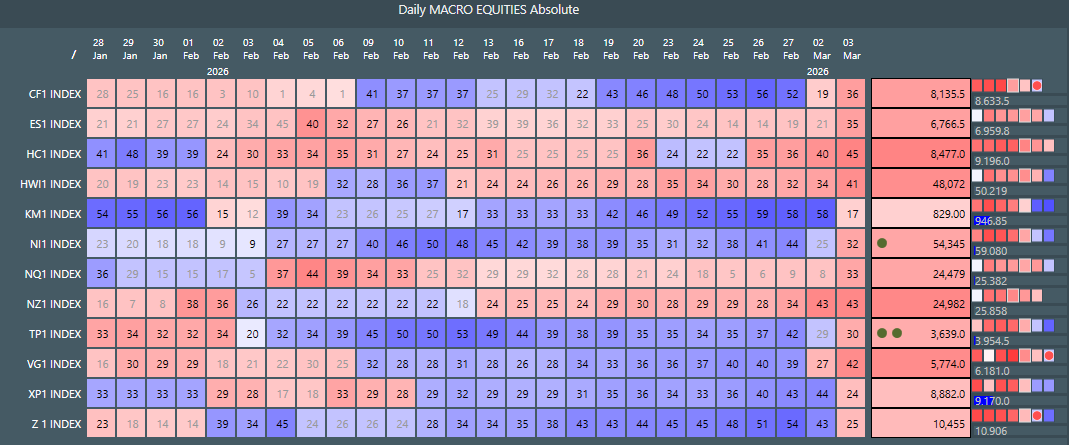
World Equity Futures. Uniform break across the board.
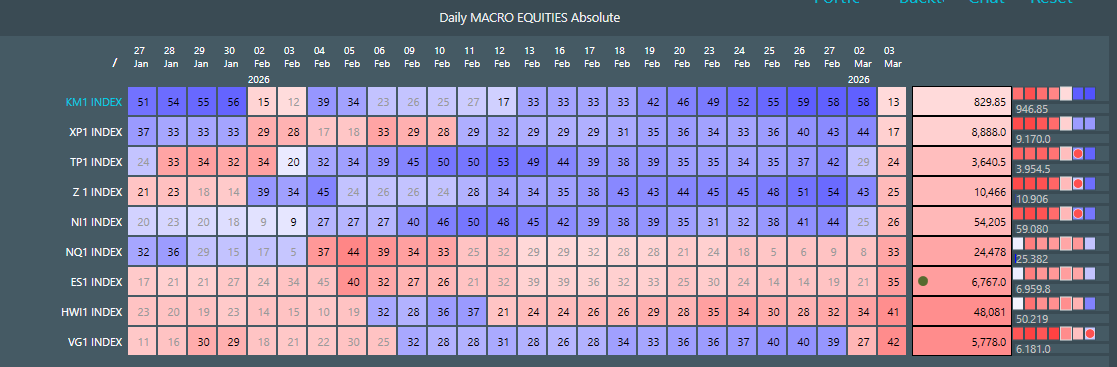
Not restricted to the US as you can see. On weekly view only 13% have not turned red yet, but are close. This is the first time we have seen this broad break to red in five years of data (the lookback period of the heatmap).
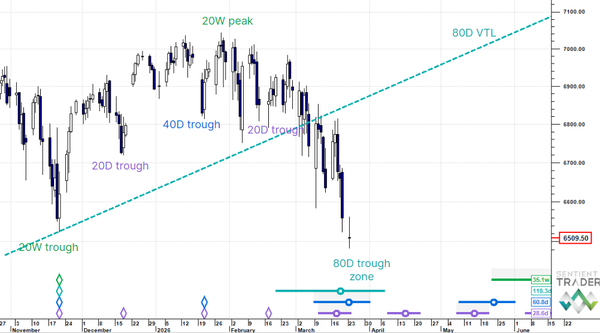
SPX E-Minis. Topping.
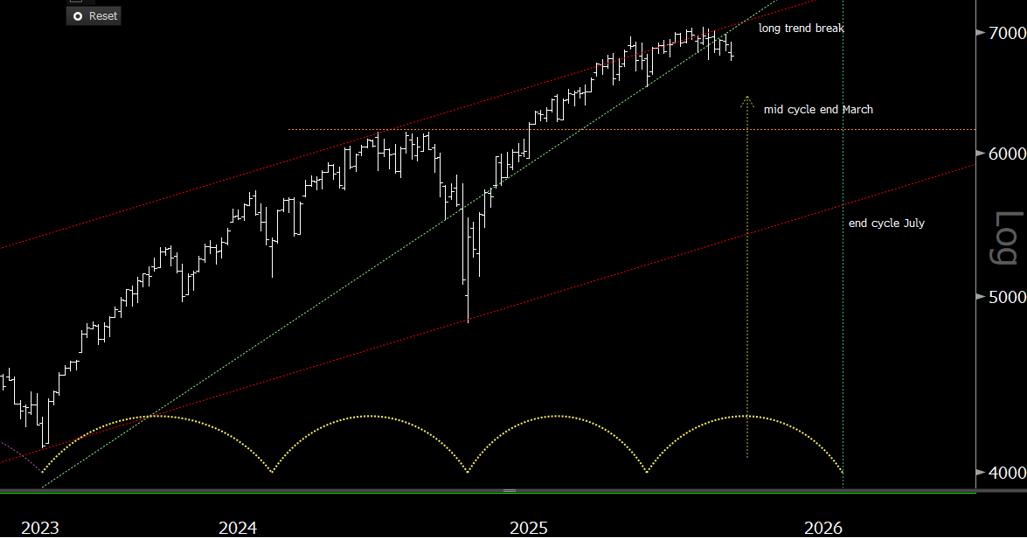
The cycle described by the semicircle is the 40 week, running a little short. A long trend support line was broken three weeks ago, retested the trend line from below last week and has pivoted down again so far this week. The bottom of the current 40 week cycle is July (not at 5,500 btw that's just to show time location of expected trough). We expect a mid cycle to start up at end March (the 20 week) but because the longer cycle is falling, we expect this to be countertrend.