
STOXX long view & drill down -3 November 2022
Link to guidance notes for Hurst cycles terminology: FLD, VTL, Translation, Diamonds, Circles/Whiskers...
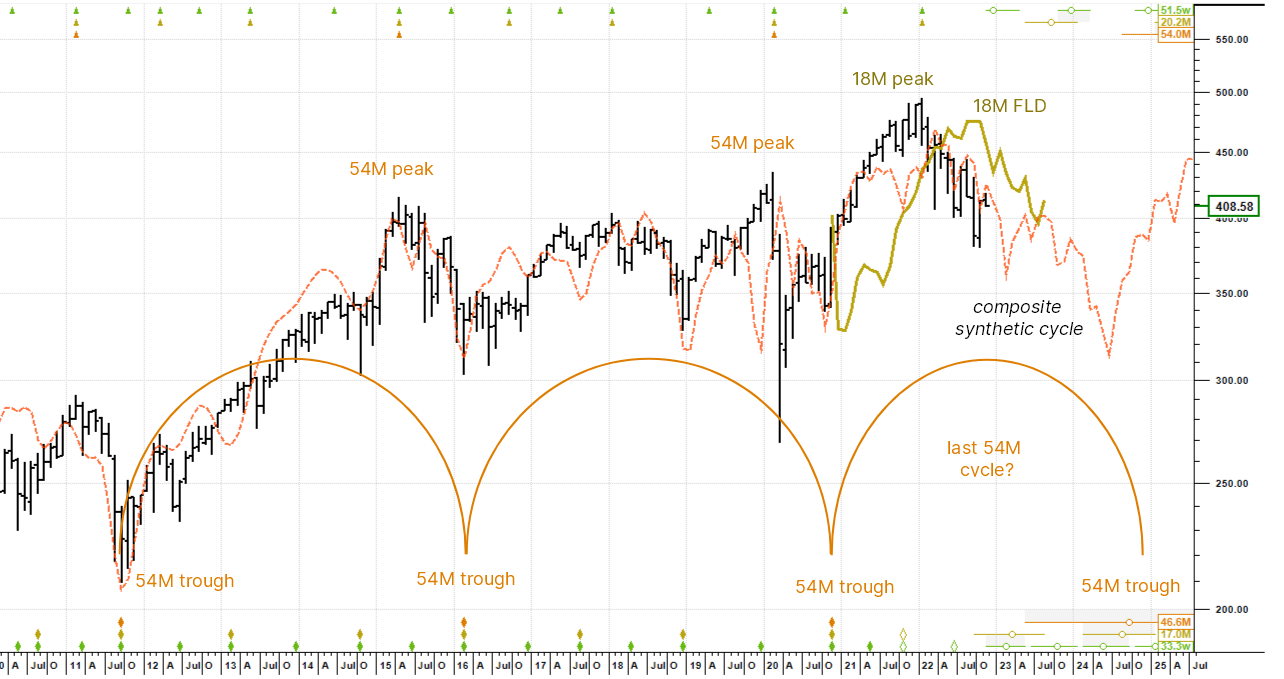
Hurst cycles analysts tend to start with the big picture, long chart first. This helps orientate us as to the broad direction of trend going forward. When a cycles analyst talks about trend, he or she tends to be thinking this: what will be the net effect of all of the cycles added together, from very long to short, in the grand scheme of things (the nominal model). The orange dashed fluctuating line displays just that. It is the synthetic composite of all cycles summed and gives a good sense for future trajectory.
We can glean some useful information from the get go in the monthly chart here: (1) the October 2020 low was the last trough of the current 54 month cycle. Look down at the key at the bottom right of the chart and you will see that the average wavelength of this cycle is 46.6 months. Price is currently 24.8 months along, which means more than half way; (2) the dark yellow line is the 18 month FLD and it was crossed down by price in March of this year. This means the 18 month cycle peaked in January; (3) this cross allow us to make a theoretical downside projection to 398. Price already hit a low of 379 in October and then rallied. But the next 18 month cycle trough is not due until next March. If the trend underlying the 18 month cycle is down (so here that would be 54 month cycle) then the projection is likely to overshoot the downside.
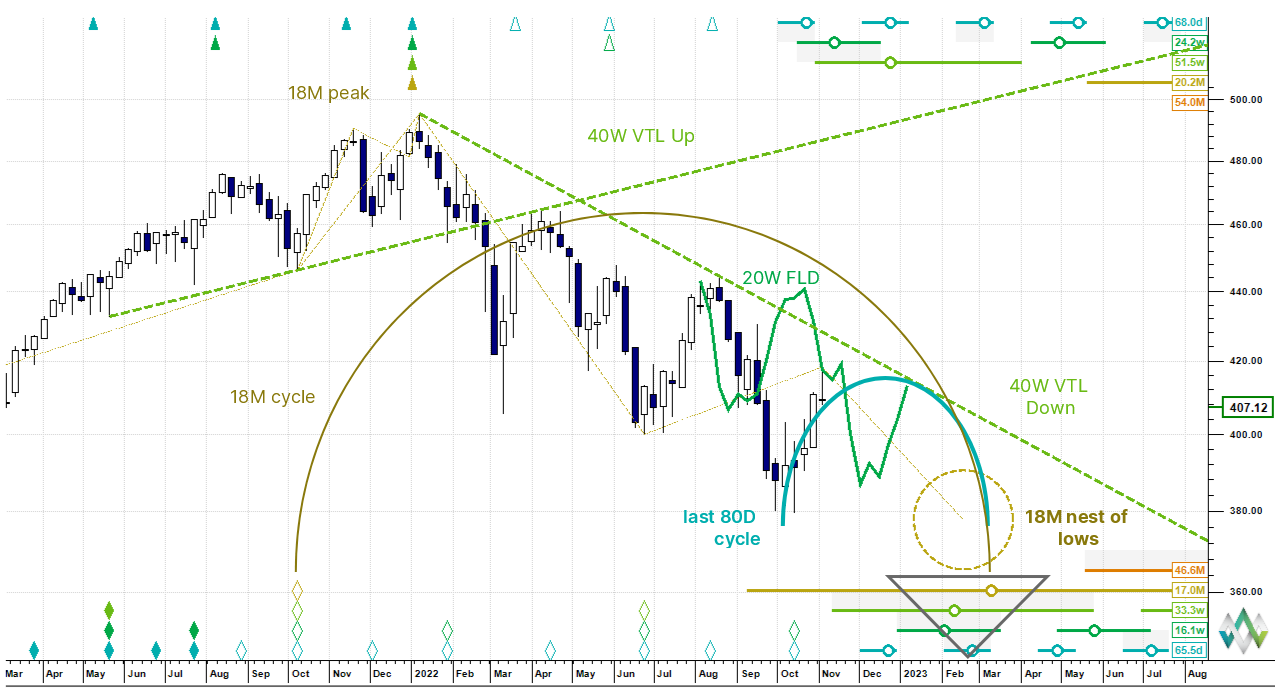
The analysis points to an 18 month cycle nest of lows occurring around 380 in March 2023. 380 is the downside projection for the 20 week FLD in green. A look to be in the last 80 day cycle now and this cycle may have topped. The anticipated price path is down.