Tadawul All Share Index (TASI) - Update - 29 March 2023
You will come across specific terms in these notes (FLD, VTL, and so on). Rather than explain them each time, you will find definitions here: guidance notes for Hurst cycles terminology
End of recent corrective structure and preferred view - back down.
- I wrote a longer term view on TASI 22 March: Tadawul All Shares Index (TASI) - Broadly down into an 18 month cycle trough this summer circa 9,000 to 9,600. Today we show the near term view and the expectation is for a sell off to start now.
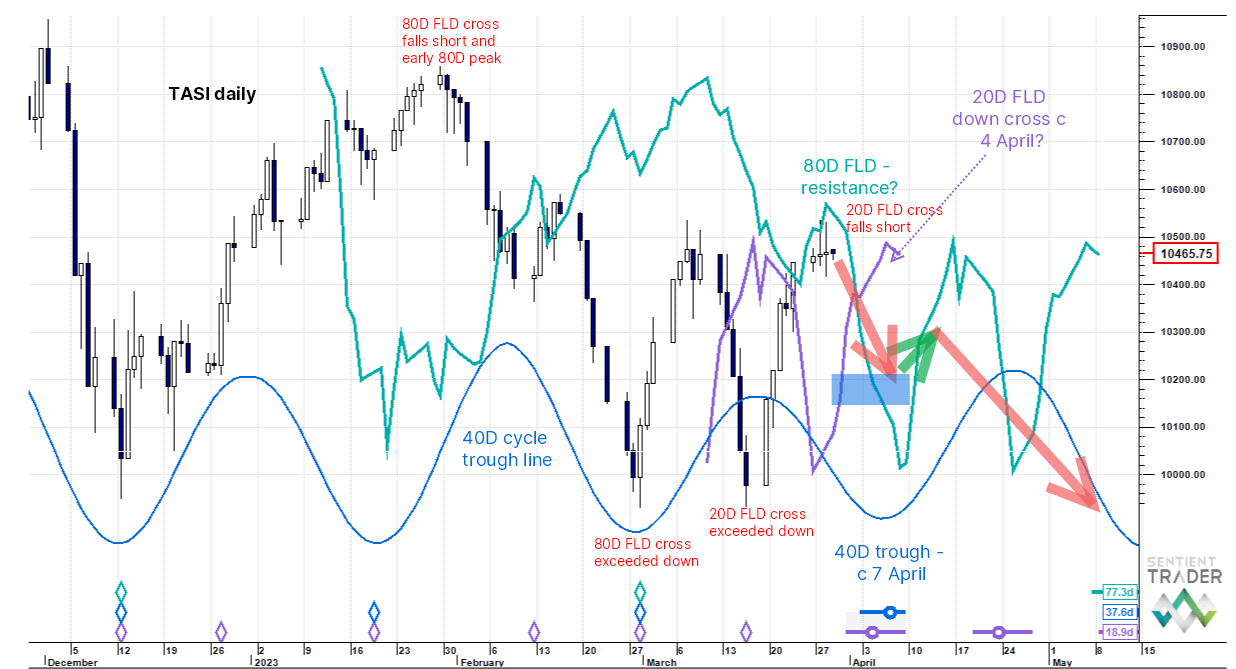
- The price structure from end February (up, down, up) looks like a downtrend correction (an abc Flat potentially for those into Elliott Wave). Price looks to be at the end of the final surge and in a 40 day cycle peak zone. The trough of this cycle is expected in the first week of April potentially between 10,200 and 10,215. After that we anticipate a muted bounce and then back down into an 80 day cycle trough mid May.
- Price has just run into an 80 day FLD and because the 20 week cycle is falling (it peaked bearishly early at the end of January) the 80 day FLD should act as a barrier here.
- The 20 day FLD was crossed up by price on 23 March and the upside projection was 10,840. But as you can see (and if price is topping here) this fell drastically short, which is bearish.
- In fact this bearishness extends to other FLD crosses in the chart which I have marked with red text. If the general tone is bearish then we expect to see upside projections fall short and downside projections exceed the target and this is exactly what has been happening. This strengthens the conviction that a sharp downside resolution is at hand.