
Sample note: Macro Outlook - 17 October 2022
This Macro Outlook was published on 17 October 2022. There are guidance notes for cycles analysis terminology in the "Getting Started" page of the website. They are interesting articles, easy to understand and will help you get the most out of the notes service.
Link to guidance notes for Hurst cycles terminology: FLD, VTL, Translation, Diamonds, Circles/Whiskers...
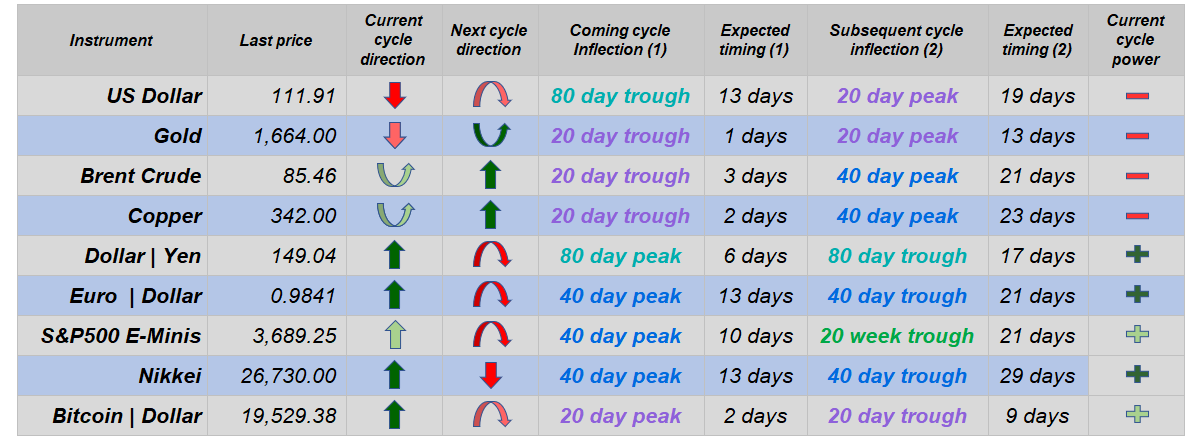
Dollar Index
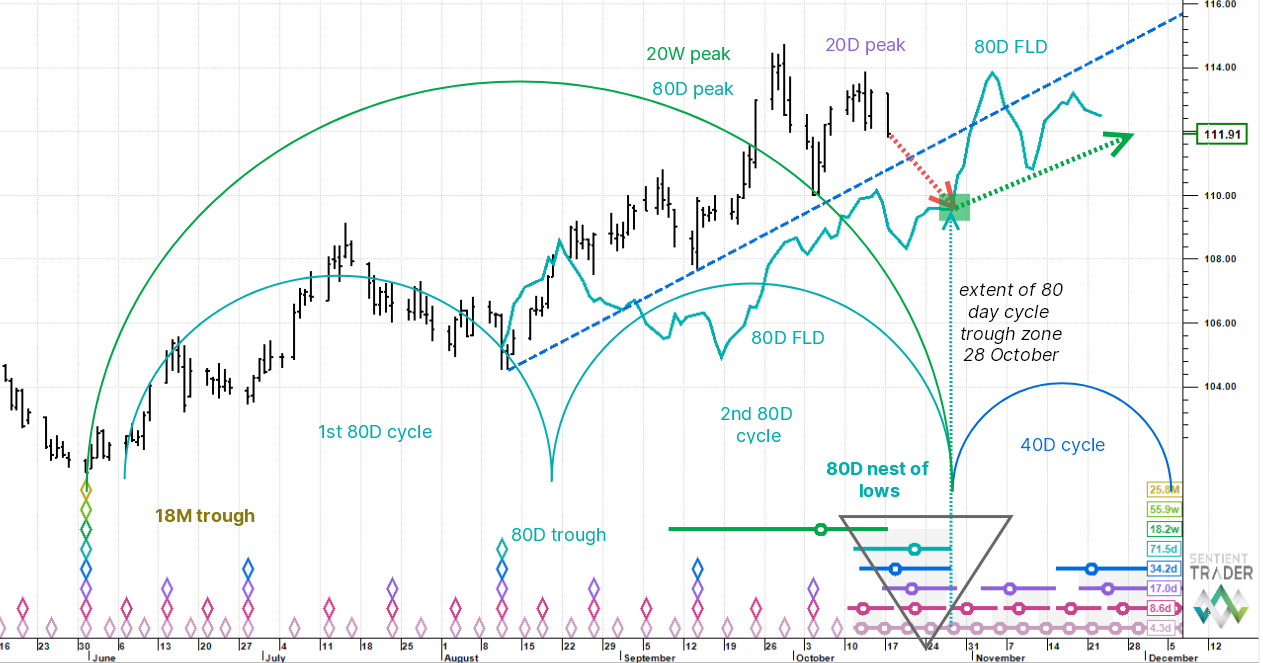
Analysis: in last week's Macro Outlook we were stalking the last 20 day cycle of the 80 day cycle that peaked on 29 September. The shorter cycle has now topped just shy of 114 (in the last note we said no higher than 115). The aiming point now is the 80 day cycle trough itself, which is expected at the end of October around 110. A penetration of the darker blue upsloping 40 day VTL line around 111.5 confirms the 80 day cycle peak and the lighter blue 80 day FLD should serve as support around the time of the 80 day cycle trough and circa 110. It is likely that the 18 month cycle troughed in June and, if so, this cycle is still rising and implies that the broad underlying trend is up. Therefore, once the current cycles of interest bottom, we expect an uptrend re-join.
Gold
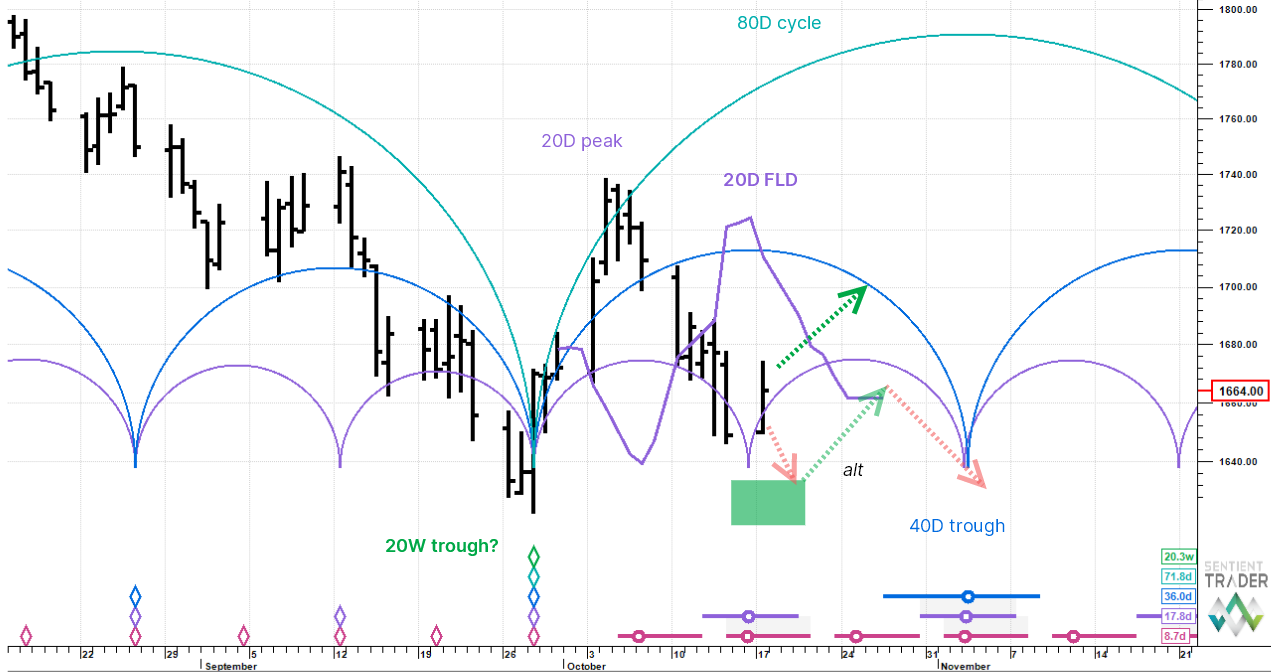
Analysis: in last week's note we were stalking the trough of the 20 day cycle, which was due mid-month. Price fell as expected and we are now past this point in time with price so far attempting to stabilise. Although price is more or less exactly where it needs to be for a rally with the new 20 day cycle, there are a few problems. The first is that a downside 20 day FLD projection (purple line) is still live and looking for 1,621, which is 40 points lower. The second is that the 20 day cycle trough is not actually confirmed until price passes back up the through the 20 day FLD and that is not until 1,696. The preferred view is that the FLD projection was cut short because of the underlying uptrend (we now think the end-September low was that of a 20 week cycle) and we advance from here. The alternate view is that we trickle lower and then bounce.
Brent Crude
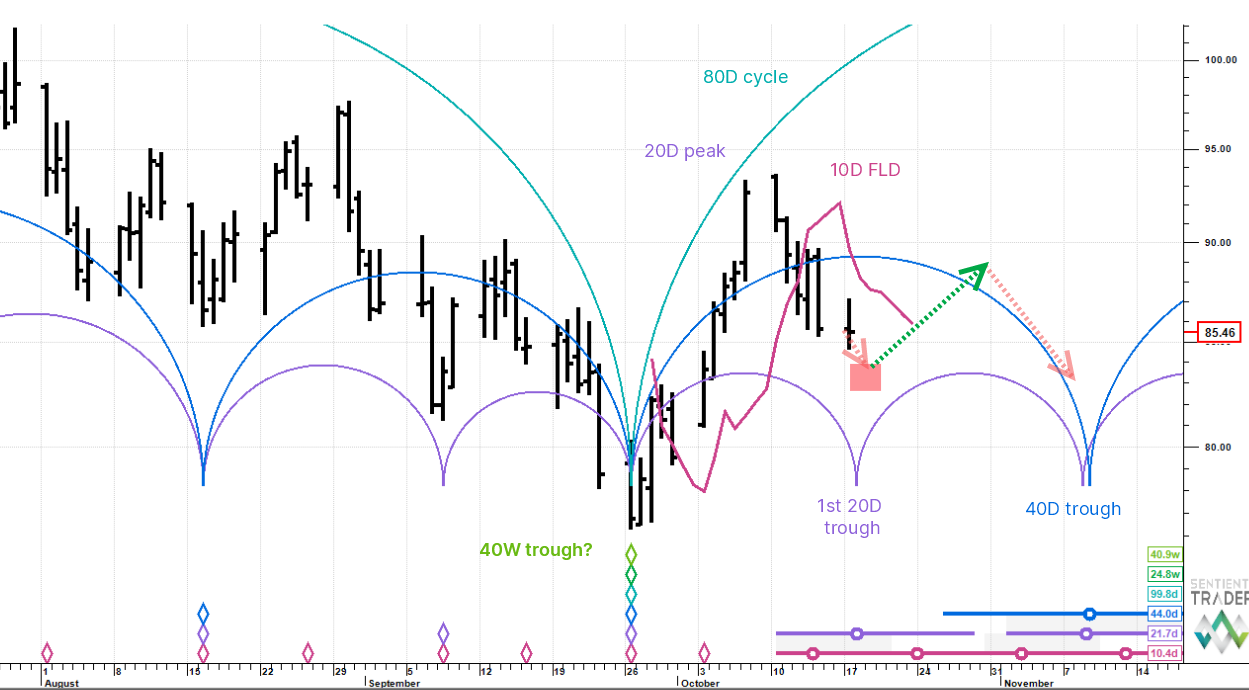
Analysis: in last week's note, we were looking for near term small down into a 20 day cycle trough. In terms of time, we are pretty much there, but notice in the chart that the whisker to the right of the 20 day cycle expected trough circle is extended forward in time. This means that there is a range for the trough's time location and it could still be ahead of us. Additionally, the downside cross of the 10 day FLD projects to just above 82 from the 10 October top, so there are about minus 3 yet to play for on the downside. The preferred view is a little push lower and then rotate up into potentially the 40 day cycle peak in the first week of November.
Copper
Analysis: in last week's not we were still looking down for a 20 week cycle trough potentially occurring this week. The downside projection from the 10 day FLD is 325. Copper may have passed through an 80 day cycle trough on 28 September, which represents a bullish tailwind. After the imminent 20 day cycle rounds out through its trough the expectation is for a push up into the 40 day cycle peak circa 370 peak around the first week of November.
Dollar | Yen
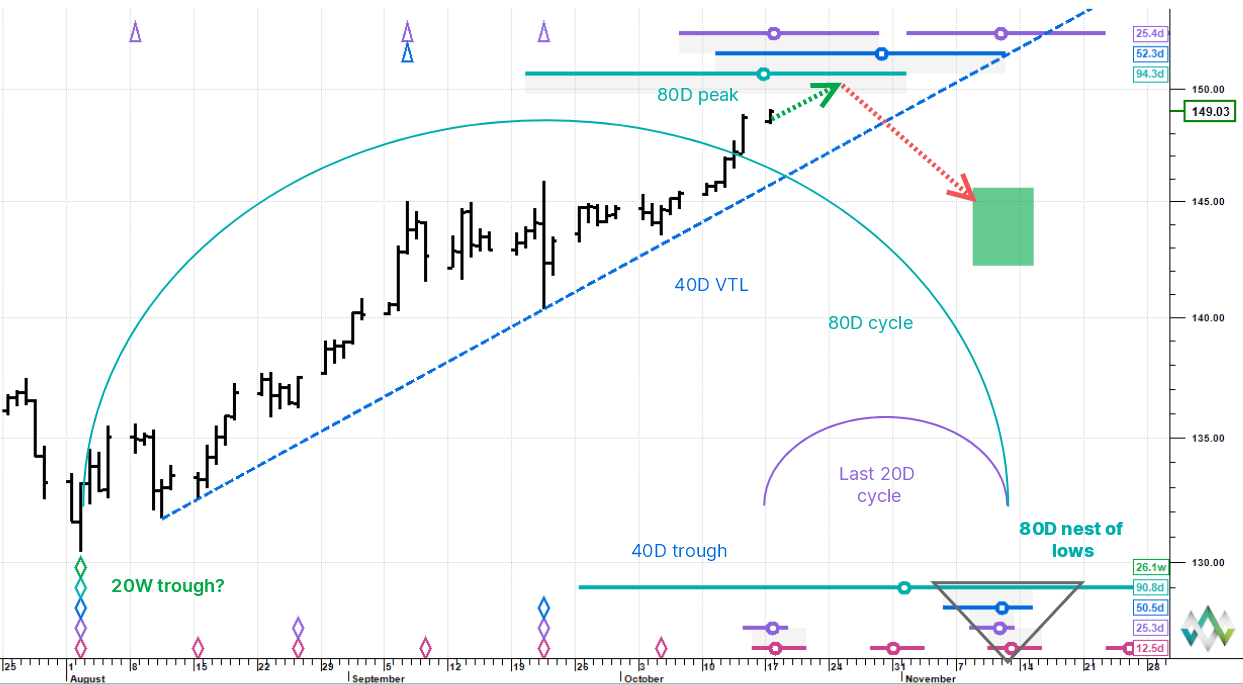
Analysis: as highlighted in last week's note, price is still pushing towards the psychologically important 150 level, which also happens be near enough a 25 year high. Price is also overstretched at 2 standard errors above the a regression channel mean plotted from the 2011 low (not shown). The 80 day cycle top is due and potentially this week: the cluster of circles and whiskers at the top of the chart show the likely placement area. Out of the top we are expecting a sharp decline into the next 80 day cycle trough around mid-November somewhere between 140 and 145, but this view is likely to become clearer once price has turned down.
Euro | Dollar
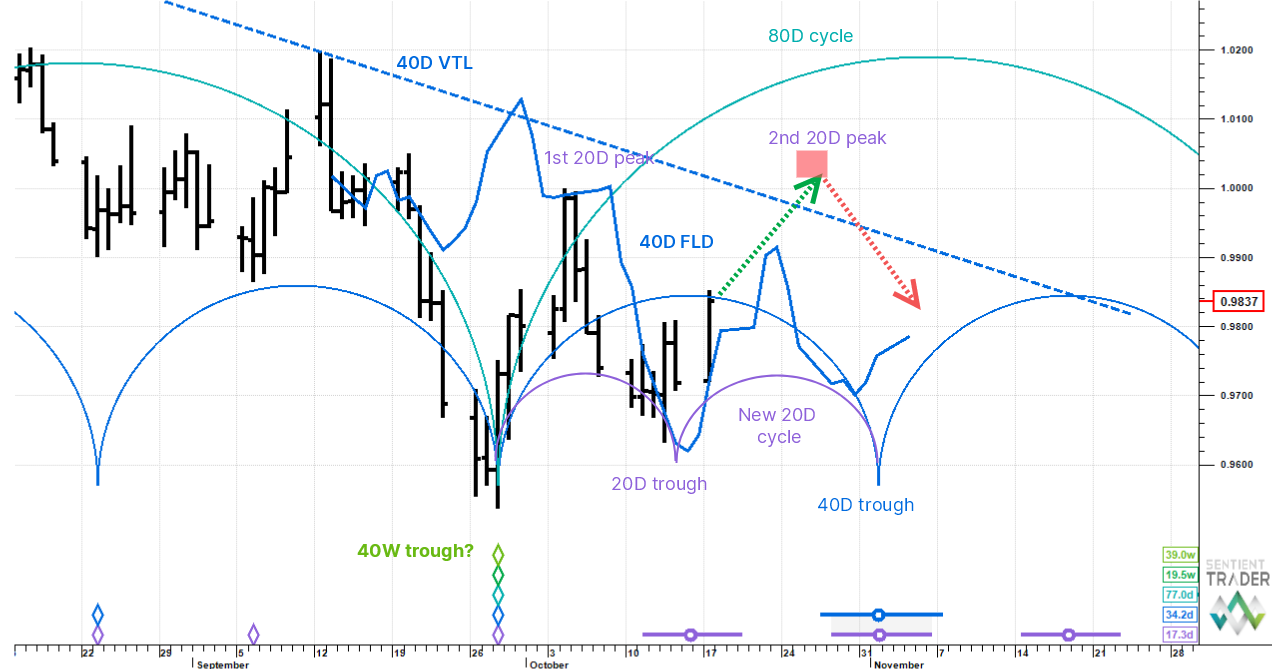
Analysis: in last week's note we were looking for an imminent 20 day cycle trough at just below 0.96. The cycle low came in on time but just a little higher. The Euro is now advancing towards the second 20 day cycle peak since the big low at the end of September and this in fact also makes the target the 40 day cycle peak. This is due at the end of October and will likely reach parity based on a 40 day FLD upside projection. The next thing to understand is that if price reaches the target then it would have had to pass through that the down-sloping blue 40 day VTL. If this happens then at the very least we can say that the 80 day cycle troughed on 28 September (and potentially also the longer 20 week cycle).
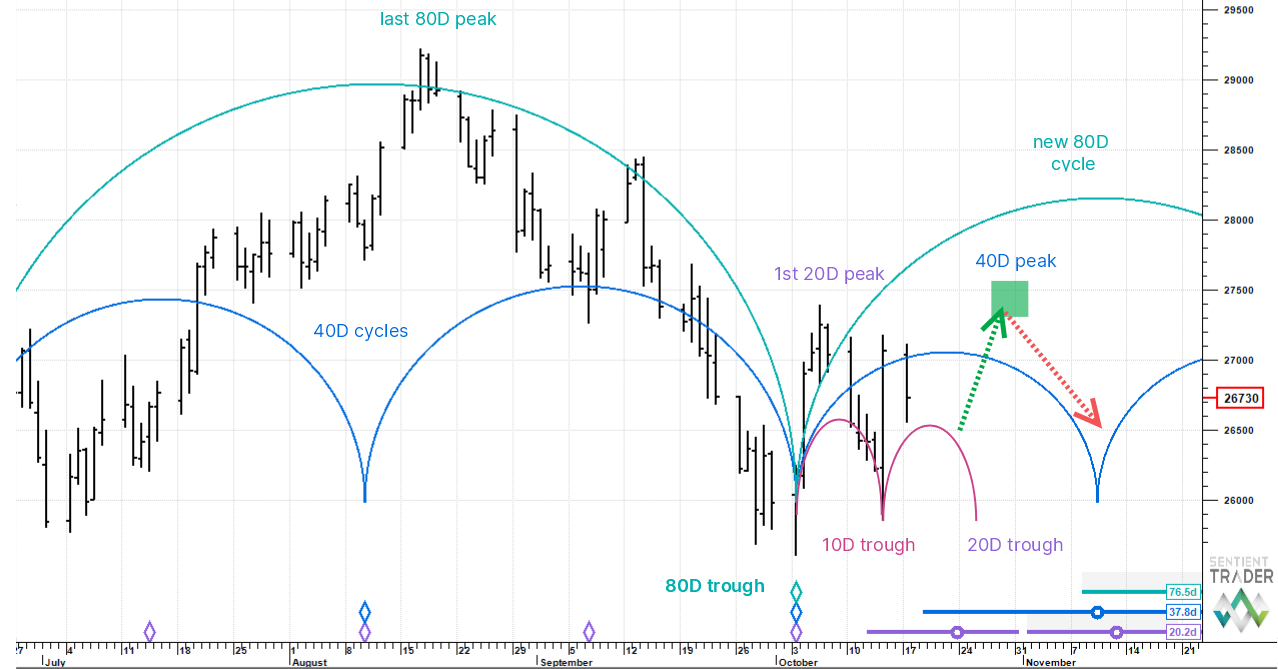
S&P 500 - E-Minis
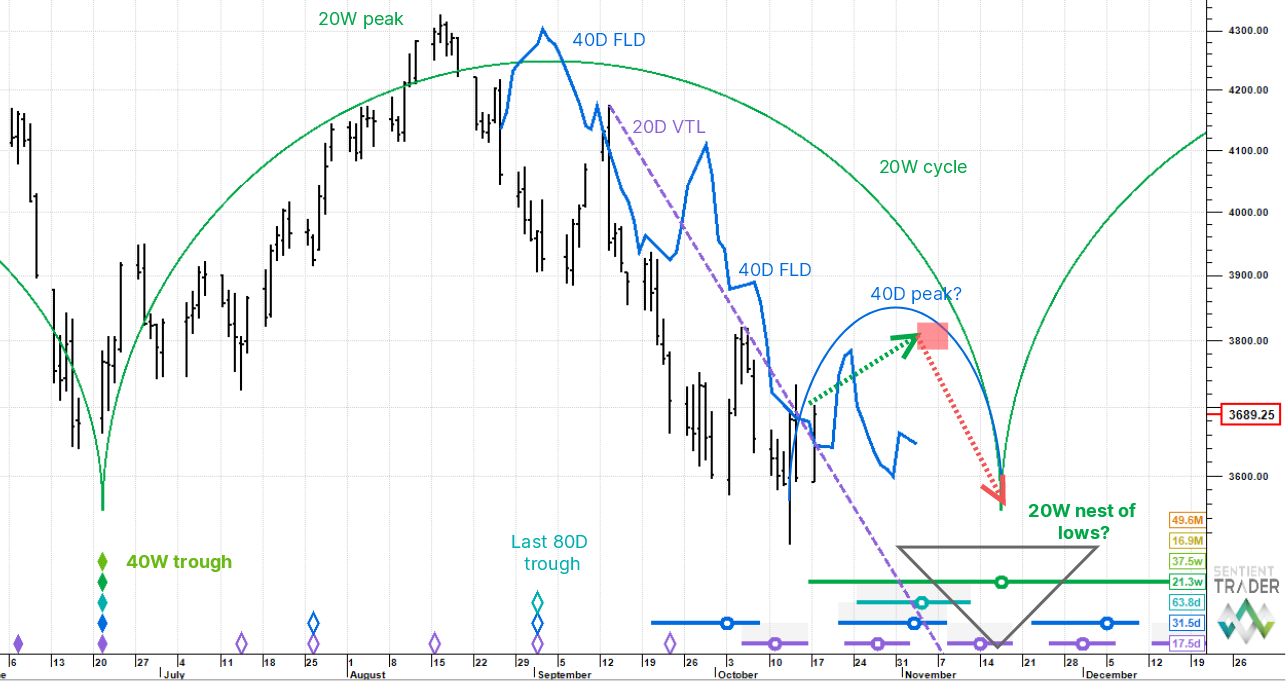
Analysis: the recent 40 day cycle trough placement is problematic, but the message should be the same even were an adjustment to be made: Up into the next 40 day cycle peak, which is due at the end of October. Two other things to note here: the blue 40 day FLD has almost been penetrated to the upside potentially giving a projection of 3,794. Also the down-sloping purple 20 day VTL -valid trendline has almost been crossed up, which would confirm that the 40 day cycle trough is in place. The view remains, until proven otherwise, that the expected advance in this cycle is a head fake and once it tops out, price needs to fall hard into the mid-November 20 week cycle trough.
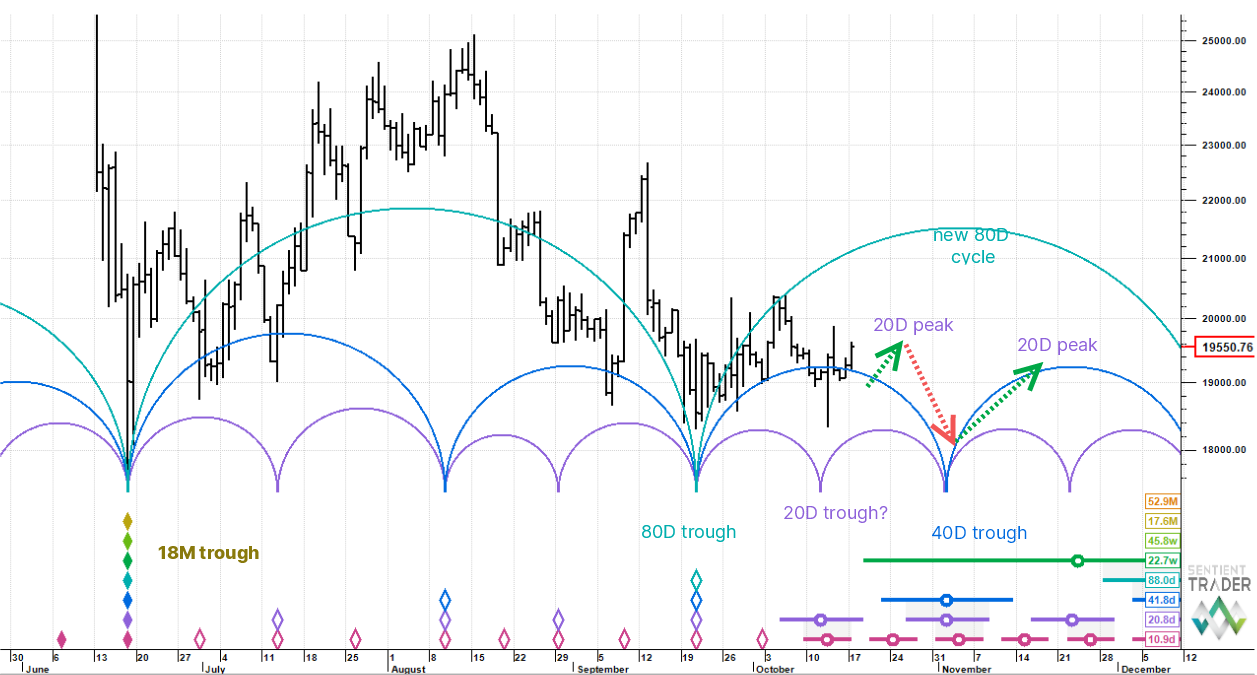
Nikkei
Analysis: in last week's note we were stalking an imminent 10 day cycle trough, the first in the first 20 day cycle out of the big 80 day cycle trough posted on 3 October. The 10 day cycle trough has now formed and price is heading back up on its way to a 40 day cycle peak expected at the end of October just below 28,000. Thereafter the preferred view is for a pullback into the 40 day cycle trough expected mid-November. There still remains a conflict in the analysis between S&P E-minis and Nikkei futures - the call for the S&P is for a dramatic nose dive into a 20 week cycle trough. We expect the respective analyses to resolve themselves shortly, but in the meantime a push up, stall and fail view is common to both series.
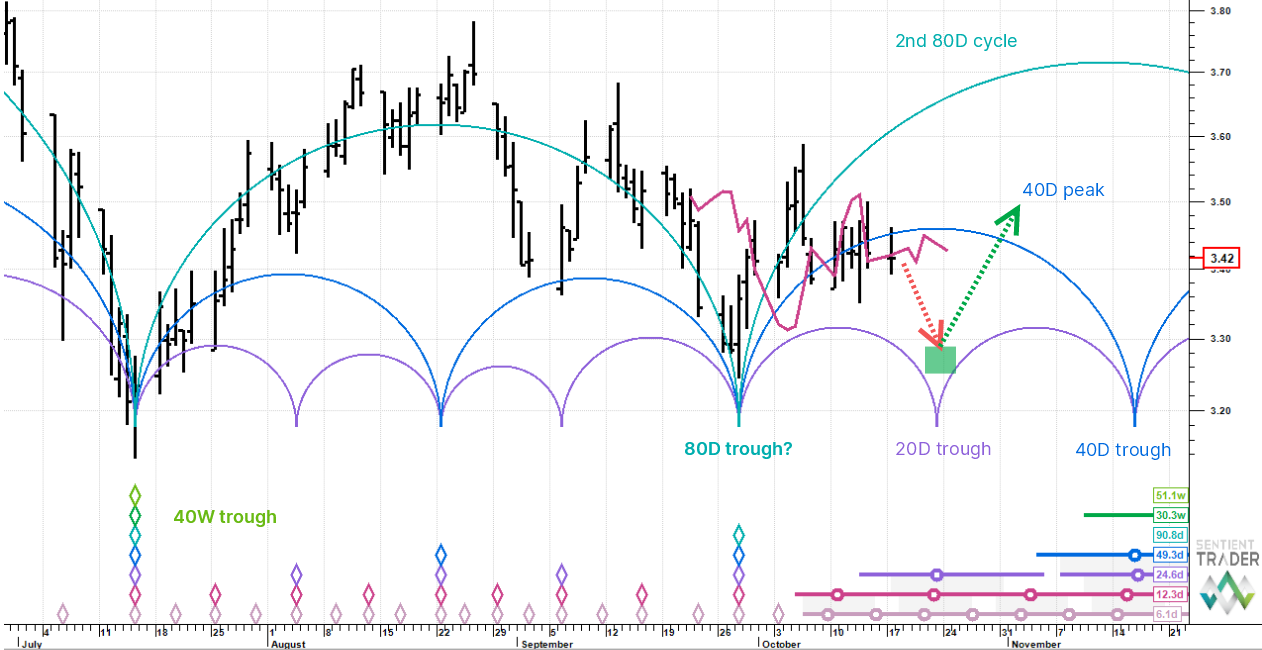
Bitcoin | Dollar
Analysis: a new 80 day cycle started up in Bitcoin on 22 September. Also bear in mind that the mid-June low is confirmed as that of a new 18 month cycle which skews underlying trend to bullish. The 20 day cycle just bottomed and we are still tracking the upswing of this cycle into the 20 day cycle peak expected in the third week of October. After that a brief reset and continuation higher beyond 20,000.