From Analysis to Trading
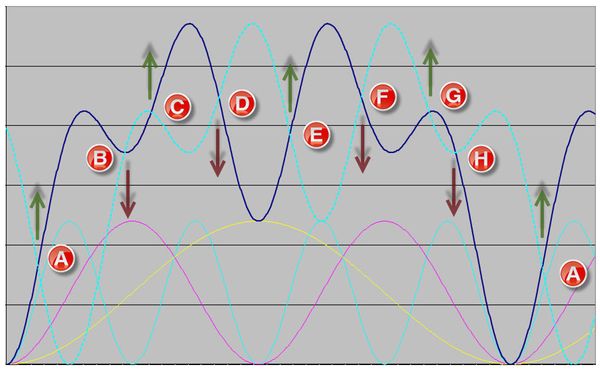
This aspect of Hurst’s theory is once again distinguished from other cyclic theories. Most cyclic theories advocate buying a market when the cycle is rising and selling when the cycle is falling. Hurst’s trading methodology on the other hand considers the fact that price is the result of a composite of many cycles, and only advocates buying when a cycle is rising, and a number of cycles longer than the trading cycle (in the harmonic collection of cycles) are also rising. Similarly, one should only short the market when a number of cycles longer than the trading cycle are also falling. There are further guidelines to be observed before selling short, because of the principle of synchronicity which tells us that troughs are synchronized – and therefore much easier to trade, whereas peaks are not synchronized and are therefore more complicated to identify, and much more difficult to trade.
In this article I will describe the process Hurst recommended for making trading decisions on the basis of a phasing analysis. The principles of this Hurst methodology form the basis of all trading approaches on the basis of a Hurst cycles analysis.
Timing Trade Entries and Exits
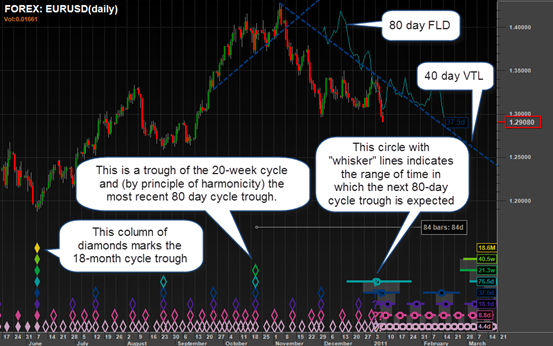
Beyond the above overall guideline as to when one should enter the market, trading according to Hurst’s cyclic theory requires that one times one’s trading actions by means of using two cyclic tools: the FLD (Future Lines of Demarcation) and the VTL (Valid Trend Line).
The FLD (Future Line of Demarcation) of a particular cycle is calculated by transposing the median price by half the wavelength of the cycle in question into the future.
The VTL (Valid Trend Line) of a particular cycle is a trend line which joins two consecutive troughs or peaks of that cycle (as seen in the price movement), and then further validated by obeying a few simple rules defined by Hurst.
These tools provide evidence of a cyclic nature that a trough or peak of a particular cycle has occurred, and so they are used to create what Hurst called “action signals” – when price crosses an FLD or VTL a signal is generated, whereupon one should take an action (such as buying or selling).
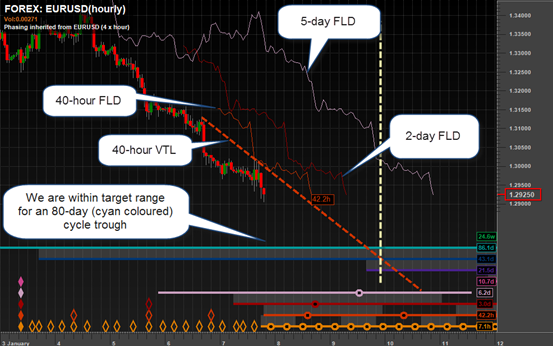
This is all very well, but if one were to wait for evidence that one’s trading cycle had experienced a trough (by waiting for price to cross the FLD or VTL applicable to that cycle) then one would have missed a good deal of the price move. This is where the true beauty of Hurst’s principles emerges. Because of the principle of synchronicity (which states that troughs are synchronized) one knows that the trough of the trading cycle will be synchronized with the troughs of several shorter cycles. Therefore, when evidence is received that a trough of a much shorter cycle has occurred (by price crossing the FLD or VTL applicable to that shorter cycle) then one can take action. Because of the shorter wavelength of this synchronous trough, one catches much more of the price move.
Beyond Hurst (intraday trading & other strategies)
Hurst published his theory almost 50 years ago, and it is a testament to the validity of the theory that it can be applied effectively to the markets today. Of course, now we have the extra benefit of being able to work with the power of modern computers. It has been an exciting and rewarding experience to extend Hurst’s theory into the realm of intraday analysis, a journey which has presented many challenges. For instance, it is a feature of Hurst’s cyclic theory that cycles move through time, regardless of whether we are trading financial markets or not. A cycle keeps moving through the weekend, but we have no evidence of it because we aren’t trading. When analysing daily data this is not much of a problem, but when analysing intraday data, it becomes a big problem. On a Monday morning one is faced with a gap of over 60 hours in most markets, during which time there would have been a good deal of cyclic activity. There would have been 7 or 8 full waves of the 8-hour cycle, and if that cycle is your chosen trading cycle, Mondays present an interesting challenge: it will usually take several hours to identify the current phasing of the 8-hour cycle.
In addition to extending Hurst’s work into the intraday realm my team and I have developed several other trading methodologies, which provide a structured approach to making trading decisions based on the cycle analysis. A particularly popular strategy is the FLD Trading Strategy which identifies trading opportunities based on the regular sequence of interactions between price and the FLD of each cycle.