Hurst Cycles Glossary
This post is a glossary of terms used in Hurst Cycles Notes.
JM Hurst was an aeronautical engineer who worked at Bell laboratories and used mainframe computers in the 1960's to study the price movements of financial markets. He discovered that they exhibited the characteristics of a time-series influenced by multiple cycles. Hurst published a book called "The Profit Magic of Stock Transaction Timing" in 1967 (still available today), and he published the "Cyclitec Cycles Course" in 1970 which was a workshop-style course consisting of over 1000 pages, audio cassettes and fold-out charts.
An analysis of a price movement performed in the manner described by JM Hurst in his cycles course is called a phasing analysis, because it determines the current phase of each cycle in the nominal model. Hurst referred to an analysis as a "formal phasing analysis", which nowadays we shorten to "phasing analysis"
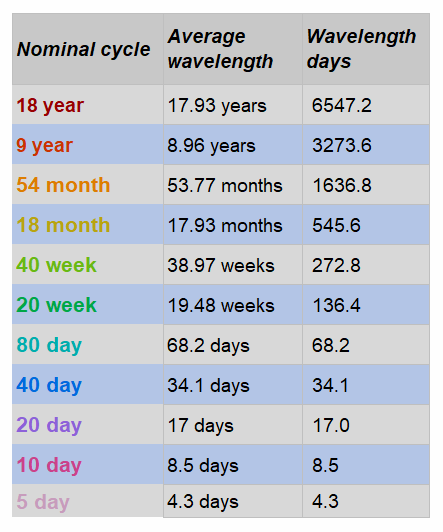
The nominal model is effectively a list of cycles that are included in a phasing analysis. A nominal model consists of cycles with wavelengths that are related to one another by a simple ratio (usually 2:1 or 3:1). The original "default" nominal model was defined by Hurst based on the research that he performed (in the 1960's) into the prices of US stocks. Here is the nominal model that Hurst defined:
Hurst's original research was performed on the price movement of stocks in the United States. He discovered the principle of synchronicity, which states that the cycles that influence the price movement are synchronized, where possible, at their troughs. The result of this is that stock prices tend to form sharp isolated troughs and rounded clustered peaks. Recent research suggests that some markets (precious metals and commodities for instance) are influenced by cycles that are synchronized at their peaks, and so we now refer to a trough analysis as an analysis performed on the basis of the troughs being synchronized as opposed to the peaks being synchronized.
This is an analysis that is made on the assumption that the cycles influencing the price action are synchronized at their peaks, as opposed to their troughs (see trough analysis). This is appropriate for instruments that are influenced by cycles synchronized at their peaks, such as precious metals and commodities, but it can also provide useful insight to the timing of peaks in instruments which are influenced by cycles synchronized at their troughs.
Because a trough analysis is made on the basis that the cycles are synchronized at their troughs and a peak analysis made on the basis that the cycles are synchronized at their peaks, they are by necessity two completely separate analyses. It is possible to look at these two analyses on a single chart, in which case we refer to a dual analysis. It is important to bear in mind that these two analyses are completely separate, which means that the peak of a particular cycle found in the peak analysis is not necessarily the peak, or highest price, between two of that cycle's troughs found in the trough analysis. A dual analysis is particularly useful when analyzing that presents evidence of being influenced by cycles synchronized at their troughs at some times, and at their peaks at others, such as is the case with currency pairs.
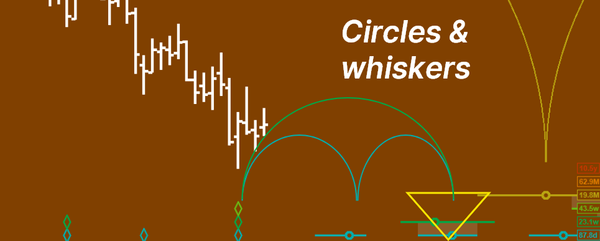
Hurst developed a notation for marking the position (in time) of the troughs (and sometimes peaks) of cycles found in an analysis. He placed a diamond beneath the price to mark a trough, and a triangle above price to mark the peak. In a trough analysis the troughs only are marked because they are synchronized. A solid diamond represents a trough that the analyst has confidence in, and a hollow diamond represents a trough that has been "phased" or positioned in the analysis, but with less confidence. The diamonds marking the position of each trough of a particular cycle are placed at the same level on the y-axis, and nowadays the cycles are color-coded for easy identification.
In Hurst's diamond notation past troughs (and peaks) are indicated by means of a diamond (or triangle) on the chart. Expected future trough (and peak) positions are indicated by means of a circle, positioned ahead of the most recent trough (or peak) of that cycle by the recent wavelength of that cycle. The recent wavelength is calculated by averaging the wavelengths of past six waves of the cycle (or the waves over the past 180 bars if that is greater than six waves).
The circle represents the exact time, according to the recent wavelength that the next trough (or peak) of the cycle is expected. A range of "reasonable" time before and after the circle is indicated by a line to each side of the circle. The combination is referred to as the "circle-and-whiskers".
Because cycle troughs are synchronized (in a trough analysis - peaks are synchronized in a peak analysis), the circles of the next trough (or peak) of a particular cycle will tend to line up above (or below in the case peaks) the circles of the shorter cycles that will form synchronized troughs (or peaks). This alignment of circles (and their whiskers) forms what Hurst called a "nest-of-lows" (or in the case of a peak analysis, a "nest-of-highs"). Because the longer cycles have a greater range of "reasonable" time in which the trough could form, and therefore longer whiskers, nest-of-lows form triangle shapes, with one point of the triangle on the date scale at the foot of the chart.
Nests-of-lows are indications of times at which cycle troughs are expected to form. A tighter the nest-of-lows is generally an indication of a clearer analysis situation, whereas spread-out nests-of-lows indicate a less clear analysis, or one where the cycle wavelengths are in the process of shortening of lengthening.
The first stage of a full phasing analysis is a form of spectral analysis which extracts the wavelengths of cycles present in the price action. The results of the spectral analysis are then compared to the nominal model used for the analysis (usually Hurst's "default" nominal model, but occasionally we use different nominal models), and new cycle model is created. Hurst called this model the Initial Cyclic Model (ICM). The ICM has the same structure as the nominal model, in terms of the harmonic ratios between the cycle wavelengths, but the wavelengths themselves could differ markedly from the wavelengths of the original nominal model. The full analysis process that follows is a pattern-recognition process that identifies the phasing of each cycle in the model. In the case of an NM analysis cycles which match the original nominal model are given greater emphasis, and the results are an analysis that presents a lesser variation from the nominal model.
Refer to the above discussion about an NM analysis. In the case of an ICM analysis greater emphasis is given to the Initial Cyclic Model (ICM) created with the results of the spectral analysis. This can result in an analysis that has much longer or shorter wavelengths than those specified in the nominal model. Sometimes it is a better analysis, sometimes not. If the cycle wavelengths differ markedly from the nominal wavelengths the reason is usually because it is an ICM analysis.
Hurst defined eight principles which distinguish Hurst cycles from any other cycles approach to the markets. See this post for more detail about the principles, or read on to learn about the most important of these principles .
This principle effectively tells us that the cycles that influence all markets are related, and that when a particular magnitude cycle trough is forming in one market there is a good chance that the same (or similar magnitude) cycle trough is forming in other markets. Some markets have an inverse correlation, and so when a trough forms in one market, a peak of similar magnitude is likely forming in an inversely correlated market.
One might imagine that the longer cycles exert a greater influence on price action at any moment, but this principle states that the cycles which combine to produce the price movement do so by a process of simple addition, and although the amplitude of each cycle differs, the effect of each cycle at any one time is considered to be roughly equal to any other cycle.
The wavelengths of neighboring waves in the collection of cycles contributing to price movement (the nominal model) are related by a small integer value. In other words a cycle will have double (2:1 harmonic ratio) or triple (3:1 harmonic ratio) the wavelength of the cycle shorter than it in the nominal model.
Perhaps the most distinguishing feature of Hurst's approach, this principle states that the troughs of cycles are synchronized (occur at the same time) when possible. It is not possible for every trough to be synchronized because of the different wavelengths of the cycles. In recent times we have come to accept that some markets are influenced by cycles that are synchronized at their peaks instead of their troughs, such as precious metals and many commodities.
This principle tells us that the amplitude of each cycle is proportional to its wavelength. A longer wavelength cycle has a greater amplitude, or effect on the price movement.
This principle explains that a specific, nominal collection of harmonically related cycles is found in all price movements - the nominal model.
Another very important principle that tells us the wavelengths and amplitudes (and also the harmonic ratios and even the synchronicity of the troughs) are subject to variation. In other words the wavelengths and amplitudes differ with each wave of a cycle. Although we work with a nominal model of fixed wavelengths, the cycles are dynamic and constantly varying.